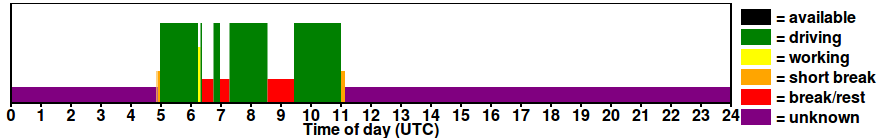
I don’t know if is possible to graph this type of chart with vaadin charts. Better than explain I paste a screen capture of the chart that i would like to graph, the abscissa axis is time line from 0:00 to 24:00 and the ordenate axis can take 6 values, the legend show it, each ordenate value have a different color.
And if is possible, could you with some example?
Regards