17.3. Code example
To get started using the Vaadin Timeline component you should first download the Vaadin eclipse plugin and install it. More information on getting it can be found at http://vaadin.com/eclipse.
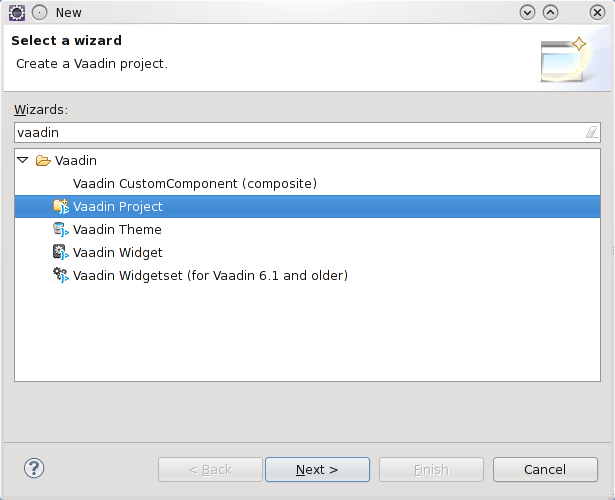
Once you got the plugin installed create an example project by selecting
→ →
and select Vaadin Project. Lets call it
MyTimelineDemo.
When the project is created you should add the Vaadin Timeline library to
your project. This can be done by copying the
timeline-*.jar to the projects
WebContent/WEB-INF/lib directory. When you copy the
library into the folder you might get the message shown in Figure 17.9, “Widget set compilation”.
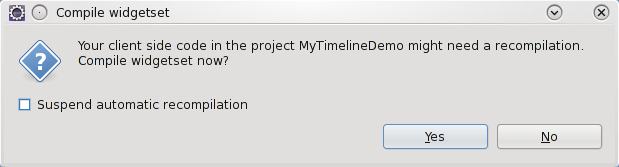
You should answer Yes and let the widgetset get compiled. If you do not get the above message or you answer No then you have to compile the widgetset manually by selecting the icon. It might take a while until the widgetset gets compiled depending of how much resources your computer have.
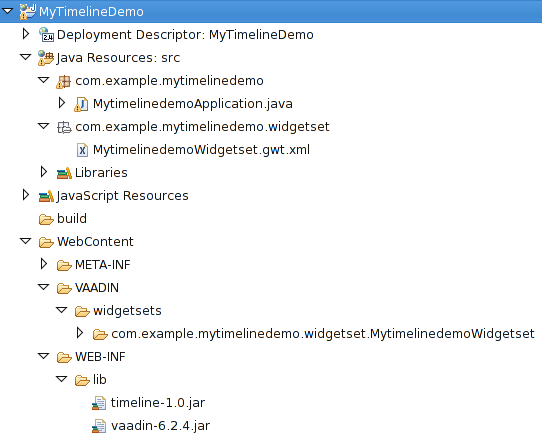
Once the compilation is done the project file structure should look something as shown in Figure 17.10, “Timeline Example Project”.
Now you are ready to start developing with the Vaadin Timeline!
To use the Vaadin Timeline you need to create some data sources for it. The Vaadin Timeline uses Container.Indexed containers as data sources for both the graphs and the markers and events. So lets start by creating a datasource which represents the graph we want to draw in the timeline.
For the Vaadin Timeline to understand how the data is constructed in the
container we need to use specific property ids which describe what kind of
data each property represents. For the Vaadin Timeline to work properly we
will need to add two property ids, one for when the value was acquired and
one for the value itself. The Vaadin Timeline has these both properties
predefined as Timeline.PropertyId.TIMESTAMP and
Timeline.PropertyId.VALUE. You can use the
predefined ones or create your own if you wish.
So, lets create a container which meets the above stated
specification. Open the main application class which was automatically
created when we created the project (in our case
MytimelinedemoApplication.java) and add the following
method.
/**
 * Creates a graph container with a month of random data
 */
public Container.Indexed createGraphDataSource(){

    // Create the container
    Container.Indexed container = new IndexedContainer();

    // Add the required property ids (use the default ones here)
    container.addContainerProperty(Timeline.PropertyId.TIMESTAMP,
        Date.class, null);
    container.addContainerProperty(Timeline.PropertyId.VALUE,
        Float.class, 0f);

    // Add some random data to the container
    Calendar cal = Calendar.getInstance();
    cal.add(Calendar.MONTH, -1);
    Date today = new Date();
    Random generator = new Random();

    while(cal.getTime().before(today)){
        // Create  a point in time
        Item item = container.addItem(cal.getTime());

        // Set the timestamp property
        item.getItemProperty(Timeline.PropertyId.TIMESTAMP)
            .setValue(cal.getTime());

        // Set the value property
        item.getItemProperty(Timeline.PropertyId.VALUE)
            .setValue(generator.nextFloat());

        cal.add(Calendar.DAY_OF_MONTH, 1);
    }

    return container;
}
This method will create an indexed container with some random points. As
you can see we are using an IndexedContainer and
define two properties to it which was discussed earlier. Then we just
generate some random data in the container. Here we are using the default
property ids for the timestamp and value but you could use your own if you
wished. We'll see later how you would tell the Timeline which property ids
to use if you used your own.
Next, lets add some markers to our graph. Markers are arrow like shapes in the bottom of the timeline with which you can mark some occurrence that happened at that time. To create markers you again have to create a data source for them. I'll first show you how the code to create them and then explain what it all means. Add the following method to the main Application class:
/**
 * Creates a marker container with a marker for each seven days
 */
public Container.Indexed createMarkerDataSource(){

    // Create the container
    Container.Indexed container = new IndexedContainer();

    // Add the required property IDs (use the default ones here)
    container.addContainerProperty(Timeline.PropertyId.TIMESTAMP,
            Date.class, null);
    container.addContainerProperty(Timeline.PropertyId.CAPTION,
            String.class, "Our marker symbol");
    container.addContainerProperty(Timeline.PropertyId.VALUE,
            String.class, "Our description");

    // Add a marker for every seven days
    Calendar cal = Calendar.getInstance();
    cal.add(Calendar.MONTH, -1);
    Date today = new Date();
    SimpleDateFormat formatter =
            new SimpleDateFormat("EEE, MMM d, ''yy");
    while(cal.getTime().before(today)){
        // Create a point in time
        Item item = container.addItem(cal.getTime());

        // Set the timestamp property
        item.getItemProperty(Timeline.PropertyId.TIMESTAMP)
                .setValue(cal.getTime());

        // Set the caption property
        item.getItemProperty(Timeline.PropertyId.CAPTION)
                .setValue("M");

        // Set the value property
        item.getItemProperty(Timeline.PropertyId.VALUE).
           setValue("Today is "+formatter.format(cal.getTime()));

        cal.add(Calendar.DAY_OF_MONTH, 7);
    }

    return container;
}
Here we start the same as in the example with the graph container by creating an indexed container. Remember, all containers must be indexed containers when using the graph component.
We then add the timestamp property, caption property and value property.
The timestamp property is the same as in the graph container but the caption and value property differ. The caption property describes what kind of marker it is. The caption is displayed on top of the arrow shape in the Timeline so it should be a short symbol, preferably only one character long. The class of the caption property must be String.
The value property should also be a string and is displayed when the user hovers the mouse over the marker. This string can be arbitrarily long and normally should represent some kind of description of the marker.
The third kind of data sources are the event data sources. The events are displayed on top of the timeline and supports grouping and are clickable. They are represented as button like icons in the Timeline.
The event data sources are almost identical the to marker data sources except the value property is missing. Lets create an event data source and add events for each Sunday in out graph:
/**
 * Creates a event container with a marker for each sunday
 */
public Container.Indexed createEventDataSource(){

	// Create the container
	Container.Indexed container = new IndexedContainer();

	// Add the required property IDs (use the default ones here)
	container.addContainerProperty(Timeline.PropertyId.TIMESTAMP,
		Date.class, null);
	container.addContainerProperty(Timeline.PropertyId.CAPTION,
		String.class, "Our marker symbol");

	// Add a marker for every seven days
	Calendar cal = Calendar.getInstance();
	cal.add(Calendar.MONTH, -1);
	Date today = new Date();
	while(cal.getTime().before(today)){
		if(cal.get(Calendar.DAY_OF_WEEK) == Calendar.SUNDAY){
			// Create a point in time
			Item item = container.addItem(cal.getTime());

			// Set the timestamp property
			item.getItemProperty(Timeline.PropertyId.TIMESTAMP)
                .setValue(cal.getTime());

			// Set the caption property
			item.getItemProperty(Timeline.PropertyId.CAPTION)
				.setValue("Sunday");
		}
		cal.add(Calendar.DAY_OF_MONTH, 1);
	}

	return container;
}
As you can see the event container does not differ a whole lot from the marker containers. In use however they differ since they are groupable they can be closely put together and still be usable and you can add click listeners to them so you can catch user events. More on the click listeners later.
So now we have our three data sources ready to be displayed in our application. In the next chapter we will use them with our Timeline and see how they integrate with it.
Okay, now that we have out data sources lets look at the init-method in
our Vaadin Application. Lets start by creating our timeline, so add the
following line to the end of the init-method in
MytimelinedemoApplication:
Timeline timeline = new Timeline("Our timeline");
timeline.setWidth("100%");
This will create the timeline we want with a 100 percent width. Now lets add our data sources to the timeline:
timeline.addGraphDataSource(createGraphDataSource(),
                        Timeline.PropertyId.TIMESTAMP,
                        Timeline.PropertyId.VALUE);

timeline.setMarkerDataSource(createMarkerDataSource(),
                        Timeline.PropertyId.TIMESTAMP,
                        Timeline.PropertyId.CAPTION,
                        Timeline.PropertyId.VALUE);

timeline.setEventDataSource(createEventDataSource(),
                        Timeline.PropertyId.TIMESTAMP,
                        Timeline.PropertyId.CAPTION);
And finally add the timeline to the window. Here is the complete init-method:
@Override
public void init() {
    Window mainWindow = new Window("Mytimelinedemo Application");
    Label label = new Label("Hello Vaadin user");
    mainWindow.addComponent(label);
    setMainWindow(mainWindow);

    // Create the timeline
    Timeline timeline = new Timeline("Our timeline");

    // Create the data sources
    Container.Indexed graphDS  = createGraphDataSource();
    Container.Indexed markerDS = createMarkerDataSource();
    Container.Indexed eventDS  = createEventDataSource();

    // Add our data sources
    timeline.addGraphDataSource(graphDS,
                                Timeline.PropertyId.TIMESTAMP,
                                Timeline.PropertyId.VALUE);
    timeline.setMarkerDataSource(markerDS,
                                 Timeline.PropertyId.TIMESTAMP,
                                 Timeline.PropertyId.CAPTION,
                                 Timeline.PropertyId.VALUE);
    timeline.setEventDataSource(eventDS,
                                Timeline.PropertyId.TIMESTAMP,
                                Timeline.PropertyId.CAPTION);

    mainWindow.addComponent(timeline);
}
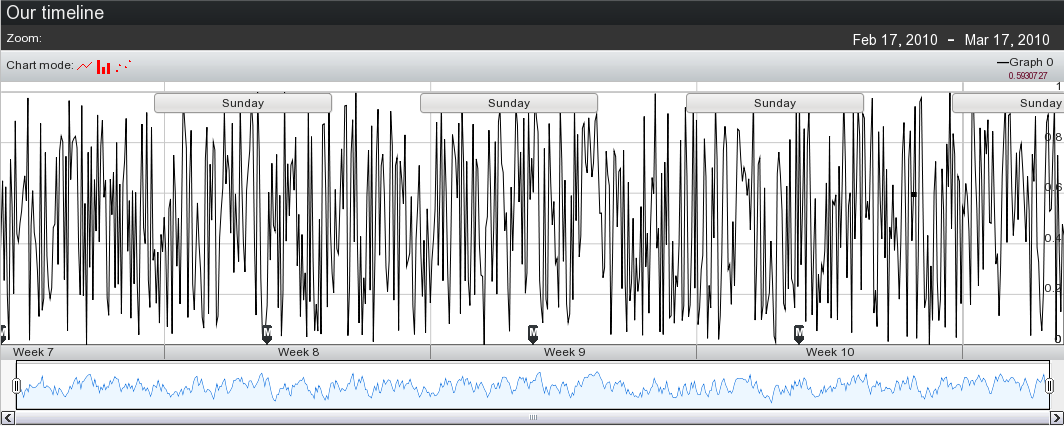
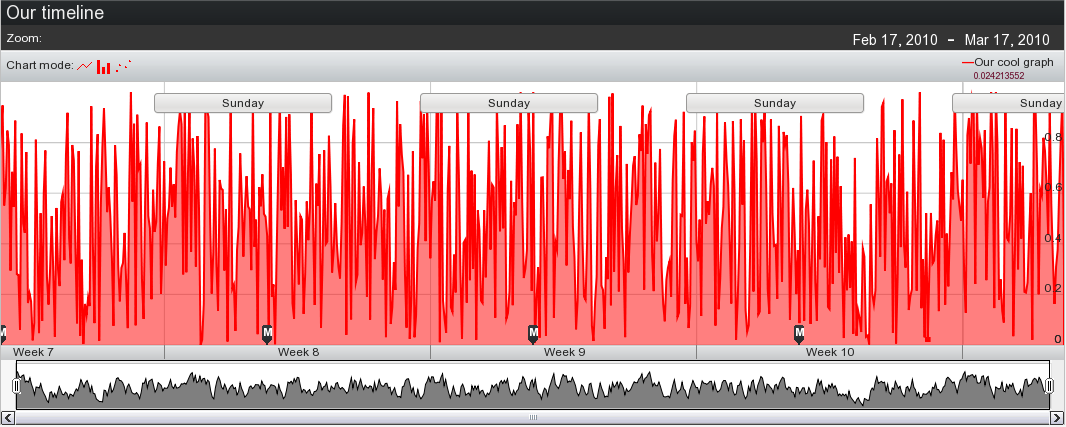
Now you should be able to start the application and browse the timeline. The result is shown in Figure 17.11, “Timeline Example Application”.
Now that we have our timeline we would probably like to customize it a bit. There are many things you can do but lets start by giving our graph some style properties and a caption in the legend. This can be done as follows:
// Set the caption of the graph
timeline.setGraphLegend(graphDataSource, "Our cool graph");

// Set the color of the graph
timeline.setGraphOutlineColor(graphDataSource, Color.RED);

// Set the fill color of the graph
timeline.setGraphFillColor(graphDataSource, new Color(255,0,0,128));

// Set the width of the graph
timeline.setGraphOutlineThickness(2.0);
Lets do the same to the browser areas graph:
// Set the color of the browser graph
timeline.setBrowserOutlineColor(graphDataSource, Color.BLACK);

// Set the fill color of the graph
timeline.setBrowserFillColor(graphDataSource,
                             new Color(0,0,0,128));
And the result looks like this:
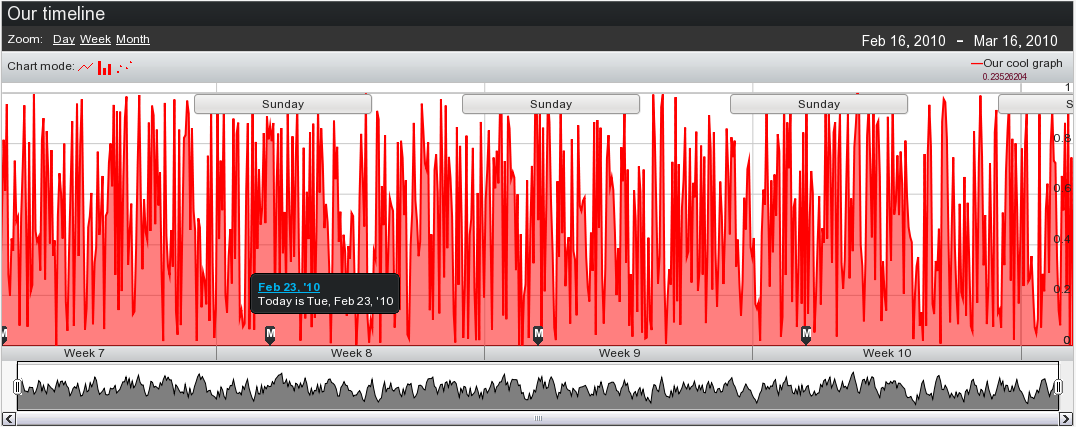
Okay, now that looks different. But there is still something missing. If you look in the upper left corner you will not see any zoom levels. No zoom levels are predefined so we will have to make our own. Since we are dealing with a month of data lets make a zoom level for a day, a week and a month. Zoom levels are given in milliseconds so we will have to calculate how many milliseconds each of the zoom levels are. So lets add them by adding the following lines:
// Add some zoom levels
timeline.addZoomLevel("Day", 86400000L);
timeline.addZoomLevel("Week", 7 * 86400000L);
timeline.addZoomLevel("Month", 2629743830L);
Remember the events we added? You can now see them in the graph but their functionality is still a bit incomplete. We can add an event listener to the graph which will send an event each time the user clicks on one of the event buttons. To demonstrate this feature lets add an event listener which notifies the user what date the Sunday-button represents. Here is the code for that:
// Listen to click events from events
timeline.addListener(new Timeline.EventClickListener() {
    @Override
    public void eventClick(EventButtonClickEvent event) {
        Item item = eventDataSource.getItem(event.getItemIds()
                                   .iterator().next());
        Date sunday = (Date) item.getItemProperty(
                      Timeline.PropertyId.TIMESTAMP).getValue();
        SimpleDateFormat formatter =
            new SimpleDateFormat("EEE, MMM d, ''yy");

        MyTimelineDemo.this.getMainWindow()
            .showNotification(formatter.format(sunday));
               }
        });
Now try clicking on the events and see what happens!
And here is the final demo application, yours will probably look a bit different since we are using random data.
Now we hope you have a basic understanding of how the Vaadin Timeline works and how it can be customized. There are still a few features we left out of this tutorial like hiding unnecessary components from the timeline and adding multiple graphs to the timeline, but these are pretty self explanatory features and you probably can look them up in the JavaDoc.
We hope you enjoy the Vaadin Timeline and find it useful in your projects!