Hello all,
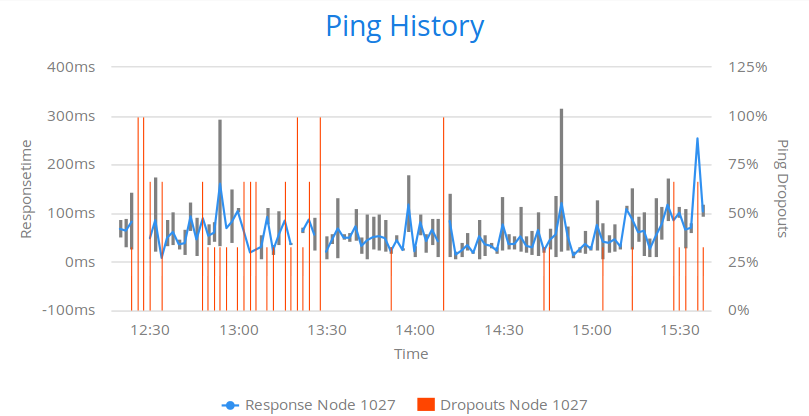
I’ll attach a picture to make my pain clearer:
the left y-axis shows a time value - should not be negative, right?
the right y-axis show a dropout percentage - should not be greater than 100% , right?
But depending on which data points are added, the axes somtimes(!) get nonsensical.
Any ideas how this come or what to do?
Best regards, Daniel
p.s.: setExtremes works only as long as pass values which are far greater than data points.
But when data points get near the “setExtreme-values” the latter are ignored.