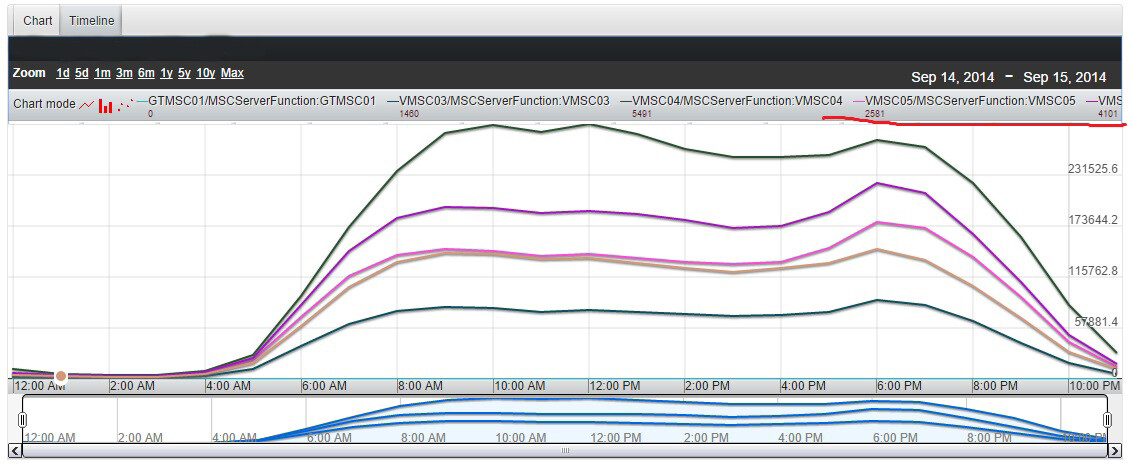
I’m using Timeline from Charts add-on. When mouse is over a point, in the Legend the value of the pointis displayed.
Is there a way to display the time of the point as well?
Thanks in advance.
I’m using Timeline from Charts add-on. When mouse is over a point, in the Legend the value of the pointis displayed.
Is there a way to display the time of the point as well?
Thanks in advance.
I have the same question. I read the manual, but got no answer so far.
showing the time of the point is a must in my situation.
if the timeline can not do that, is there any other solution?
I have the same problem, and when i add more datasources(more lines) to timeline, it doesnt show all ledgend, only display half of it, is there any way to display all ledgend entries?
Hi guys,
Sorry for the late answer.
It’s currently not possible to display the time value next to the value in the legend.
As for not showing all legends, you should be able to solve this by styling the legend with CSS. See the dashboard demo (
https://github.com/vaadin/dashboard-demo
) for an example.
HTH,
/Jonatan
Thanks for your answer.
as we know, There is a current time range at the top-right corner. Is it possible to show the time point when the user click the time series (for one point), when the mouse moves, show the time range as normal?
The exact time point is super importmant for engineers to troubleshooting.
Thanks again
Thank you for your response. Is there any way to show a spesific point time?
Unfortunately there is no real way of doing that in the Timeline chart. If there are only a few events, you can add clickable buttons by setting the Event Data Source (Timeline.setEventDataSource) and registering an EventClickListener, which can then be implemented to show any kind of information you have access to regarding the event.
Another option might be to change from using a Timeline chart to using a chart like in
the master-detail chart example
, where tooltips and click events are supported. Would that work for you?
HTH,
/Jonatan
Thanks for great suggestion. I will try clickable buttons.
Have a great day!
Ok. Thank you for the reply.