I however receive the error below when i run the project:
java.lang.NullPointerException
at com.vaadin.addon.charts.model.gsonhelpers.ContainerDataSeriesSerializer.addAnonymousTypedValue(ContainerDataSeriesSerializer.java:159)
I think the NullPointerException may be due to the fact that the ContainerDataSeries is not able to access the data from the utthrcontainer, even though it is coming from a container data source. May i kindly know if i am using the Container Data Series wrongly or perhaps the data as shown in the attached table is not enough for ContainerDataSeries. Is there any other data series i can use for container data? Many Thanks.
I have pasted the full lenght of the code, right from reading the data from a csv file into a list of rows, then binding it to the attached table with a container and then loading the same container into a container data series for the charts. I am not sure if i set the setXPropertyId here. Where can i set it in the code?
//Read scores test data using OpenCSV
CSVReader scorestestr = new CSVReader(new FileReader(“C:\Program\MATLAB\R2012b\scorestestcsv.dat”));
List scorestestrows = scorestestr.readAll();
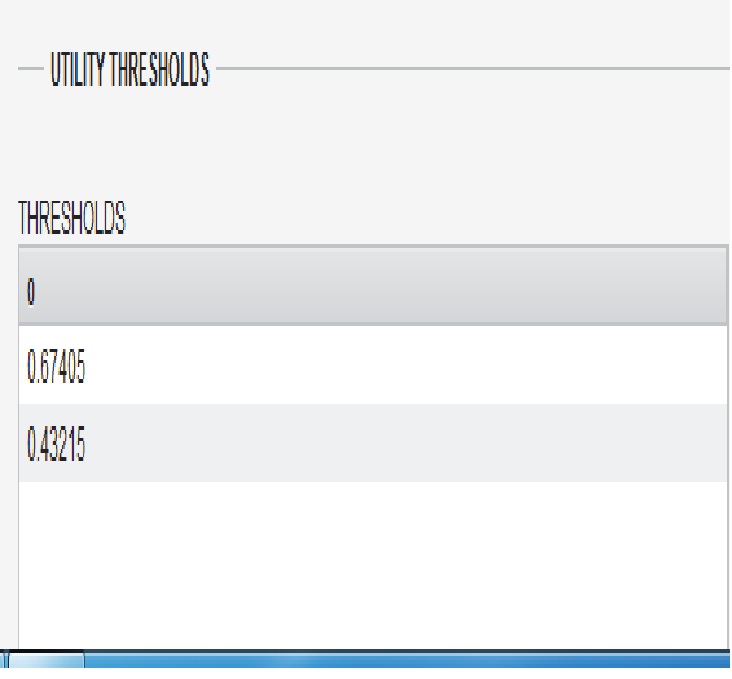
//create  Utility thresholds data table
    Table utthrtable = new Table("THRESHOLDS");
    //utthrtable.setHeight("50%");
    utthrtable.setSelectable(true);

    utthrtable.setWidth("50%");

    // Bind  Utility thresholds data to table
    CollectionContainer utthrcontainer = CollectionContainer.fromPrimitives(scorestestrows, 0);
    utthrtable.setContainerDataSource(utthrcontainer);

    // Wrap the utility threshold container in a data series
    ContainerDataSeries utthrseries = new ContainerDataSeries(utthrcontainer);


 Chart chart = new Chart(ChartType.BAR);

 Configuration conf = chart.getConfiguration();

 conf.setTitle("Historic World Population by Region");
 conf.setSubTitle("Source: Wikipedia.org");


 XAxis utthrxaxis = new XAxis();
    String utthrnames[] = new String[utthrcontainer.size()]
;
List utthrdat = (List) utthrcontainer.getItemIds();
    for (int i=0; i<utthrdat.size(); i++)
        utthrnames[i]
= utthrdat.get(i).toString();
    utthrxaxis.setCategories(utthrnames);
    utthrxaxis.setTitle("Utility Thresholds");
    conf.addxAxis(utthrxaxis);

 YAxis y = new YAxis();
 y.setMin(0);
 Title title = new Title("Population (millions)");
 title.setVerticalAlign(VerticalAlign.HIGH);
 y.setTitle(title);
 conf.addyAxis(y);

 Tooltip tooltip = new Tooltip();
 tooltip.setFormatter("this.series.name +': '+ this.y +' millions'");
 conf.setTooltip(tooltip);

 PlotOptionsBar plot = new PlotOptionsBar();
 plot.setDataLabels(new Labels(true));
 conf.setPlotOptions(plot);

 Legend legend = new Legend();
 legend.setLayout(LayoutDirection.VERTICAL);
 legend.setHorizontalAlign(HorizontalAlign.RIGHT);
 legend.setVerticalAlign(VerticalAlign.TOP);
 legend.setX(-100);
 legend.setY(100);
 legend.setFloating(true);
 legend.setBorderWidth(1);
 legend.setBackgroundColor("#FFFFFF");
 legend.setShadow(true);
 conf.setLegend(legend);

 conf.disableCredits();

 conf.setSeries(utthrseries);

 chart.drawChart(conf);

 return chart;
In the future please use the editor functionality to format code. It makes easier to read it.
But anyways on to the answer, I’d say you have to call utthrseries.setXPropertyId and utthrseries.setYPropertyId to tell the series which properties to use from the CollectionContainer as plot values. I’m not 100% on this, but this is what I suspect is needed.
Hi, i run debug and utthrseries is actually null. which implies that the container Data Series is not able to inherit the data from utthrcontainer, from this line of code: ContainerDataSeries utthrseries = new ContainerDataSeries(utthrcontainer); even though utthrcontainer contains the data. is there anyway to fix this problem?