I have been evaluating Vaadin charts (version 1.1.6) for the last couple of weeks, and I see a problem in the client-side “Chart context menu” that I cannot solve.
The good:
In my application, charts generated by users can be stored on the server. To do this, I use the SVGGenerator utility and batik. With minor issues aside, this works well.
The bad:
When I use the Exporting class (and set exporting to true in the chart’s config), I get the context menu in the upper right corner of the chart. However, the images created during download do not always come out right. If I have a chart with a small number of legend items, the downloaded chart is not exactly WYSIWYG-equivalent to what is seen on the screen, but it is at least acceptable (all data on the screen shows up in the downloaded version). However, if the chart has a large number of legend items (in my case multi-page legends), the downloaded image is not only not the same as what is displayed, many of the legend items that normally show up in page one of the legend are not visible. The chart’s Y axis is shown at a cruder scale, and the chart body is similarly compressed. My customers will expect WYSIWYG results (or close to it), and I see no way to provide that for them. The client-side “Chart context menu” is a user-friendly feature that my customers would love to use, but I see no way to deliver the chart that they see in these cases.
What I have tried:
I have spent time capturing the pixel size of the panel the chart is displayed in, and fed that to the SVGGenerator to ensure that I get all the data captured in my server-side conversions with batik, and that works well. I have taken that same pixel resolution and used that to set the width in the exporting class. This alters the size of the output appropriately, but with no affect on the framing of the output.
This is seen in png, jpg and pdf outputs. This is seen with charts of ChartType.COLUMN, but may exist in others as well.
I have attached 4 png files to illustrate the problem…
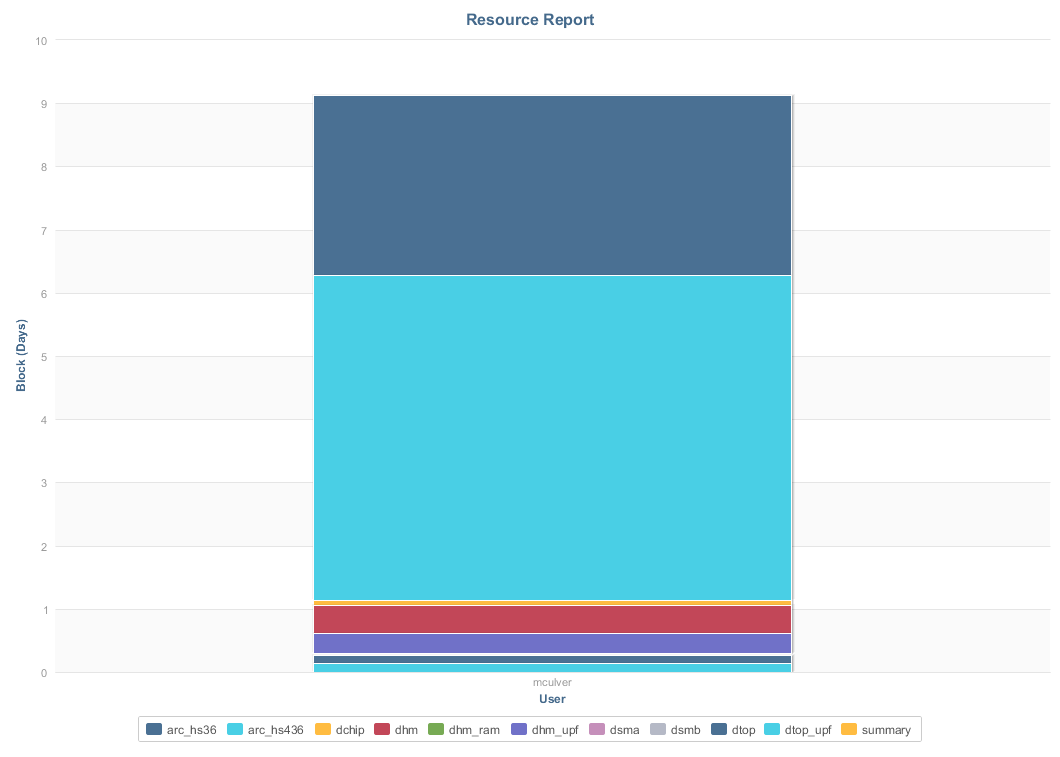
resourcereport_from_svg_and_batik_small_legend.png
This shows what is shown on the screen when the chart has a small legend.
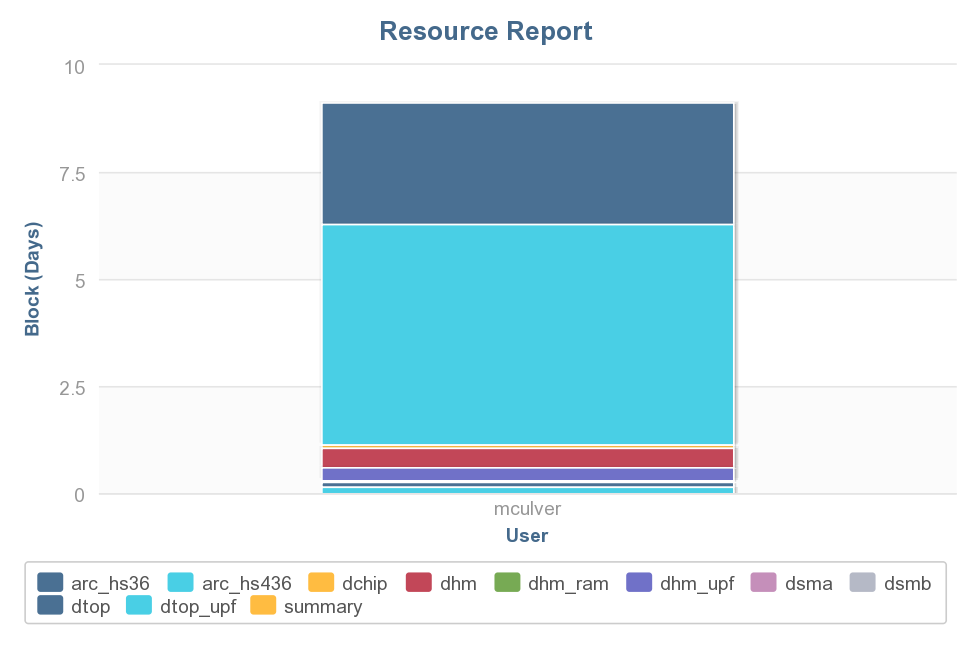
Resource_Report_from_download_small_legend.png
This shows the same small-legend chart downloaded on the client side, and is fairly close to the chart above, but not exactly.
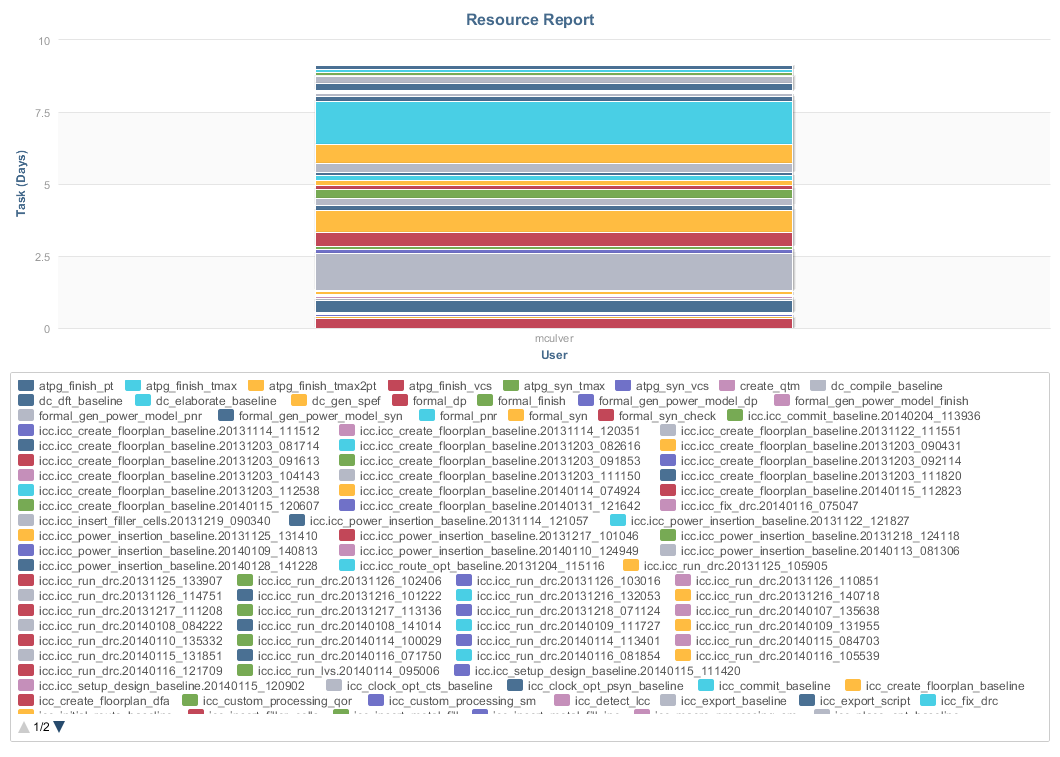
resourcereport_from_svg_and_batik_large_legend_acceptable.png
This shows a report with a multi-page legend as generated by batik. It is almost exactly the same thing seen on the screen, and is actually close enough.
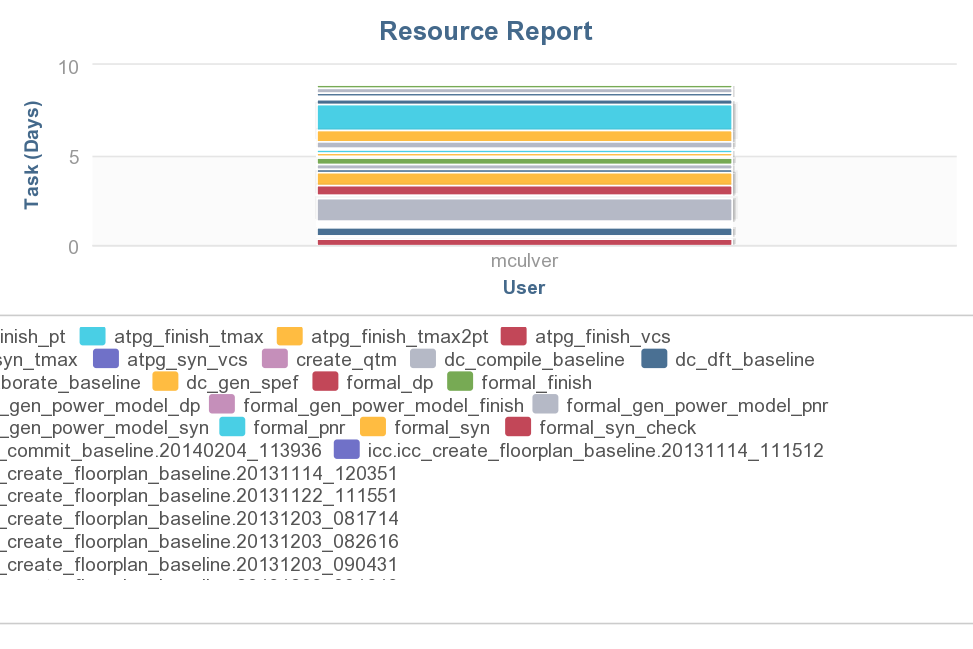
Resource_Report_from_download_large_legend_bad.png
This shows the same large-legend chart downloaded on the client side, but it is formatted very differently.