Hi
I am using Vaadin 6.8.
I jaust started using the charts addon and I don’t understand the intended effect of calling ListSeries.addData with the shift parameter set to true.
I would like my chart to always have a maximum of 50 points along the x-axis once the series contains 50 points.
So I do something like this:
        if (series.getData().length < 50)
        {
            series.addData(value, true, false);
        }
        else
        {
            series.addData(value, true, true);
        }
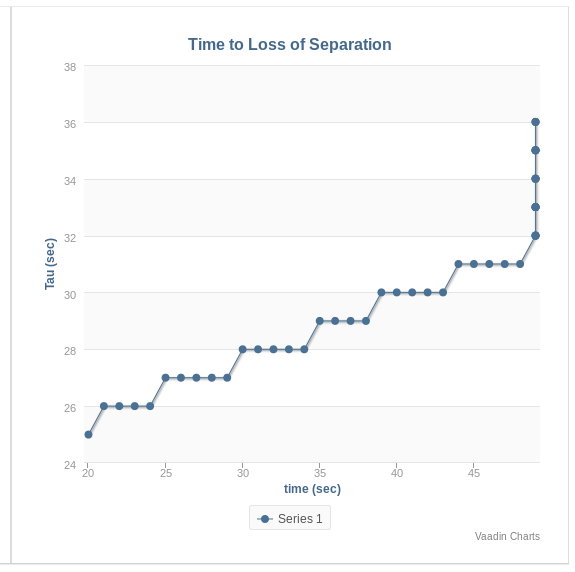
the chart is updated correctly up until it reaches point number 50. At that point it starts removing the oldest points from the chart but it also it starts plotting all the new points at the same X coordinate (new points are all along the Y axis only).
I attach a picture.
Am I misunderstanding what the shift parameter is supposed to do?
Many thanks,
-George Soler