InvientChart: How to create a bar chart with black borders around the bars?

Hello,

I’m trying to create a Bar chart with InvientCharts with black borders around the bars. Creating the Bar chart works, but whatever way I configure the chart, I don’t manage to have HightCharts draw a black border (or any border, except the default white one) around the bars.

For example, this doesn’t seem to work:

Also, setting the color for the series doesn’t seem to do anything either.
What does work: setting a pointColor for every item in the series individually.

Any idea what I might be doing wrong? Anybody managed to get this to work?

Tx,
Kim

For bar charts, use InvientChartsConfig.BarConfig to set border color or any other property specific to bar charts.

Let me know if the problem still persists.

ok, I changed it to (some code removed for clarity):

(I use the pointConfig because seriesConfig.setColor() doesn’t seem to do anything either).
Still no black border :frowning: (see attached screenshot)

When i do seriesConfig.setShadow(false), the shadows are removed, so the config is used.
11674.png

I created an example and it works perfectly fine.

Try clearing your browser’s cache and load the application again.

Cleared the cache, doesn’t help. I must be doing something wrong (obviously), but nothing that stands out at first sight. Would it be possible to post the example code? It’s always easier to start from a working example.

Thanks,
Kim

Try out following code


private void showColumnBasic() {
        InvientChartsConfig chartConfig = new InvientChartsConfig();
        chartConfig.getGeneralChartConfig().setType(SeriesType.COLUMN);

        chartConfig.getTitle().setText("Monthly Average Rainfall");
        chartConfig.getSubtitle().setText("Source: WorldClimate.com");

        CategoryAxis xAxis = new CategoryAxis();
        xAxis.setCategories(Arrays.asList("Jan", "Feb", "Mar", "Apr", "May",
                "Jun", "Jul", "Aug", "Sep", "Oct", "Nov", "Dec"));
        LinkedHashSet<XAxis> xAxesSet = new LinkedHashSet<InvientChartsConfig.XAxis>();
        xAxesSet.add(xAxis);
        chartConfig.setXAxes(xAxesSet);

        NumberYAxis yAxis = new NumberYAxis();
        yAxis.setMin(0.0);
        yAxis.setTitle(new AxisTitle("Rainfall (mm)"));
        LinkedHashSet<YAxis> yAxesSet = new LinkedHashSet<InvientChartsConfig.YAxis>();
        chartConfig.setYAxes(yAxesSet);

        Legend legend = new Legend();
        legend.setFloating(true);
        legend.setLayout(Layout.VERTICAL);
        legend.setPosition(new Position());
        legend.getPosition().setAlign(HorzAlign.LEFT);
        legend.getPosition().setVertAlign(VertAlign.TOP);
        legend.getPosition().setX(100);
        legend.getPosition().setY(70);
        legend.setShadow(true);
        legend.setBackgroundColor(new RGB(255, 255, 255));
        chartConfig.setLegend(legend);

        chartConfig.getTooltip().setFormatterJsFunc(
                "function() {" + " return '' + this.x +': '+ this.y +' mm'; "
                        + "}");               
        
        ColumnConfig colCfg = new ColumnConfig();        
        colCfg.setPointPadding(0.2);
        colCfg.setBorderWidth(1);
        colCfg.setBorderColor(new RGB(0, 0, 0));
        chartConfig.addSeriesConfig(colCfg);

        InvientCharts chart = new InvientCharts(chartConfig);
        XYSeries seriesData = new XYSeries("Tokyo");
        seriesData.setSeriesPoints(getPoints(seriesData, 49.9, 71.5, 106.4,
                129.2, 144.0, 176.0, 135.6, 148.5, 216.4, 194.1, 95.6, 54.4));
        chart.addSeries(seriesData);

        seriesData = new XYSeries("New York");
        seriesData.setSeriesPoints(getPoints(seriesData, 83.6, 78.8, 98.5,
                93.4, 106.0, 84.5, 105.0, 104.3, 91.2, 83.5, 106.6, 92.3));
        chart.addSeries(seriesData);

        seriesData = new XYSeries("London");
        seriesData.setSeriesPoints(getPoints(seriesData, 48.9, 38.8, 39.3,
                41.4, 47.0, 48.3, 59.0, 59.6, 52.4, 65.2, 59.3, 51.2));
        chart.addSeries(seriesData);

        seriesData = new XYSeries("Berlin");
        seriesData.setSeriesPoints(getPoints(seriesData, 42.4, 33.2, 34.5,
                39.7, 52.6, 75.5, 57.4, 60.4, 47.6, 39.1, 46.8, 51.1));
        chart.addSeries(seriesData);

        addChart(chart);

    }

    private static LinkedHashSet<DecimalPoint> getPoints(Series series,
            double... values) {
        LinkedHashSet<DecimalPoint> points = new LinkedHashSet<DecimalPoint>();
        for (double value : values) {
            points.add(new DecimalPoint(series, value));
        }
        return points;
    }
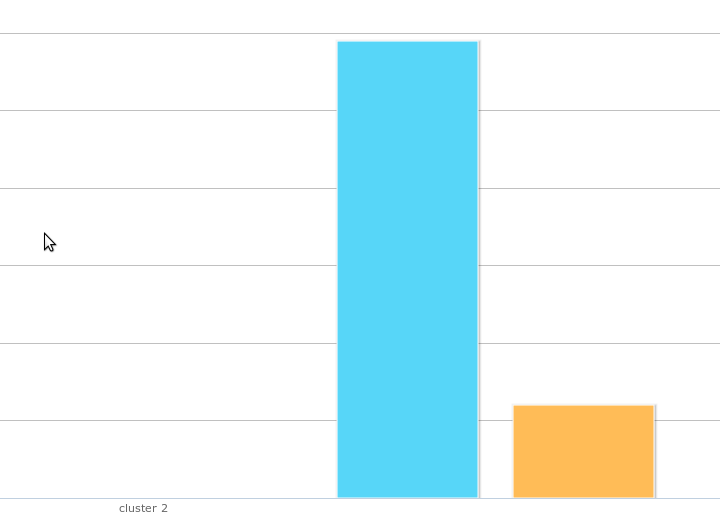
Found the problem: ‘setBorderWidth(1)’ did the trick.

Tx,
Kim

Hi:

I tried the quoted code (the same one as the add one example), and the “getpoints” doesn’t seem to work…is there a reason for this??? maybe I’m missing something really basic…

thanks!!!

Can you please elaborate?

Thank you very much for your answer…

I have the following code for my application…

package com.example.prueba10;

import java.util.Arrays;
import java.util.LinkedHashSet;

import com.invient.vaadin.charts.InvientCharts;
import com.invient.vaadin.charts.InvientCharts.PointClickEvent;
import com.invient.vaadin.charts.InvientCharts.SeriesType;
import com.invient.vaadin.charts.InvientCharts.XYSeries;
import com.invient.vaadin.charts.InvientChartsConfig;
import com.invient.vaadin.charts.InvientChartsConfig.CategoryAxis;
import com.invient.vaadin.charts.InvientChartsConfig.Tooltip;
import com.invient.vaadin.charts.InvientChartsConfig.XAxis;
import com.vaadin.Application;
import com.vaadin.ui.*;

public class Prueba10Application extends Application {
	@Override
	public void init() {
		Window mainWindow = new Window("Prueba10 Application");
		Label label = new Label("Hello Vaadin user");
		mainWindow.addComponent(label);
		
		InvientChartsConfig chartConfig = new InvientChartsConfig();
        chartConfig.getGeneralChartConfig().setType(SeriesType.COLUMN);
        chartConfig.getTitle().setText("Column chart with negative values");
        
        CategoryAxis xAxis = new CategoryAxis();
        xAxis.setCategories(Arrays.asList("Apples", "Oranges", "Pears",
                "Grapes", "Bananas"));
        LinkedHashSet<XAxis> xAxesSet = new LinkedHashSet<InvientChartsConfig.XAxis>();
        xAxesSet.add(xAxis);
        chartConfig.setXAxes(xAxesSet);
        Tooltip tooltip = new Tooltip();
        tooltip.setFormatterJsFunc("function() {"
                + " return '' + this.series.name +': '+ this.y +''; " + "}");
        chartConfig.setTooltip(tooltip);
        chartConfig.getCredit().setEnabled(false);
        InvientCharts invChart = new InvientCharts(chartConfig);
        XYSeries seriesData = new XYSeries("John");
        seriesData.setSeriesPoints(getPoints(seriesData, 5, 3, 4, 7, 2));
        invChart.addSeries(seriesData);
        
        seriesData = new XYSeries("Jane");
        seriesData.setSeriesPoints(getPoints(seriesData, 2, -2, -3, 2, 1));
        invChart.addSeries(seriesData);

        seriesData = new XYSeries("Joe");
        seriesData.setSeriesPoints(getPoints(seriesData, 3, 4, 4, -2, 5));
        invChart.addSeries(seriesData);
        
        invChart.addListener(new InvientCharts.PointClickListener() {

            public void pointClick(PointClickEvent pointClickEvent) {
                /*getApplication().*/getMainWindow().showNotification("PointX : " + (Double) pointClickEvent.getPoint().getX() + ", PointY : " + (Double) pointClickEvent.getPoint().getY());
            }
        });
                mainWindow.addComponent(invChart);
		setMainWindow(mainWindow);
	}
	

}

As you can see, is just the example code from the add-on example. I’m testing the add-on for the first time in a test application.

In eclipse, I get the following message on every “getpoints”…“The method getPoints(InvientCharts.XYSeries, int, int, int, int, int) is undefined for the type Prueba10Application”, being “Prueba10Application” the app name…

Could you please tell me if I’m missing something in the code??

regards,

Hugo

I do not see getPoints() method defined in your Prueba10Application class. You will need to copy getPoints() method from demo application.

Cheers

Hi…thank you very much for your answer…

Sorry if this question is too basic, but in the demo application there is no getPoints() method…Isn’t it included with the imports from the add-on???

regards,

Hugo

Did you look into com/invient/vaadin/InvientChartsDemoWin.java file? It contains getPoints() method.

Regards