Hi,
I’m trying to use the Timeline chart, and i have several issues i’m trying to tackle.
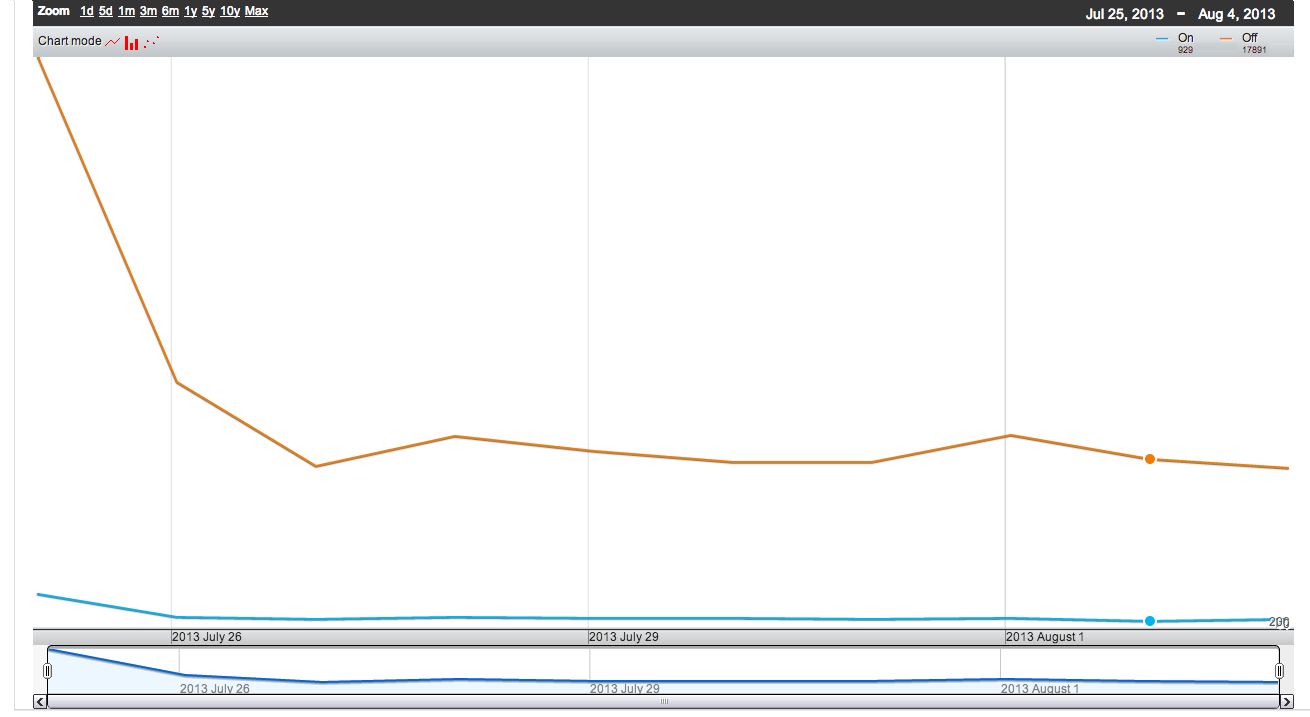
one, the yaxis values on the side are hard to see and their range is sometimes wrong, see attachment.
also, when you hover on a part of the chart, its not clear on which date you’re currently viewing, as the dates label on the axis are only partial.
how can i show on which date i’m looking at ?
Thanks.