Hi,
i have the following use case:
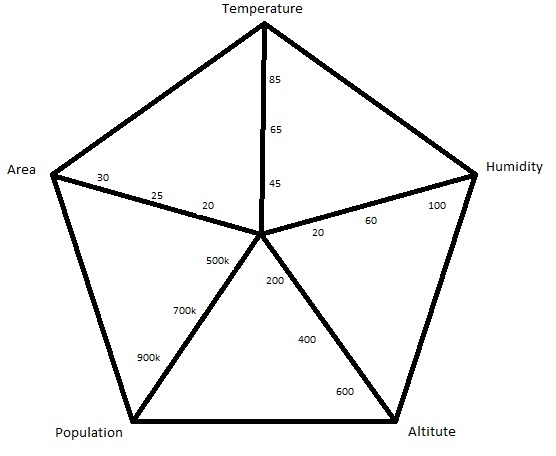
I need to display a spiderweb chart with vaadin charts, that has different scalings for the 5 Y-Axis, so i can compare multiple objects by multiple values. The base of the diagram would have to look like this:
https://www.dropbox.com/s/dqgff3xef28tmyv/spiderweb.jpg
The Vaadin Charts Sampler application only shows the usage of one common scaling and unit for all 5 axis, and i have tried to get my usecase working, the problem beeing that one does not seem to add multiple Y-Axis to the Spiderweb, but instead the one just gets redrawn for every “Category”. Adding multiple Y-Axis makes the underlying HighCharts go haywire. Maybe i am doing something wrong, i would be real glad about some pointers, Thanks!
Greetings
Kevin