Hi,
I want to display events in a line chart.
It should be be possible to see the time difference of the events by looking at the plotted line.
Unfortunately, vaadin charts keeps the distance between each data point the same. This prevents a linear display of time in the chart.
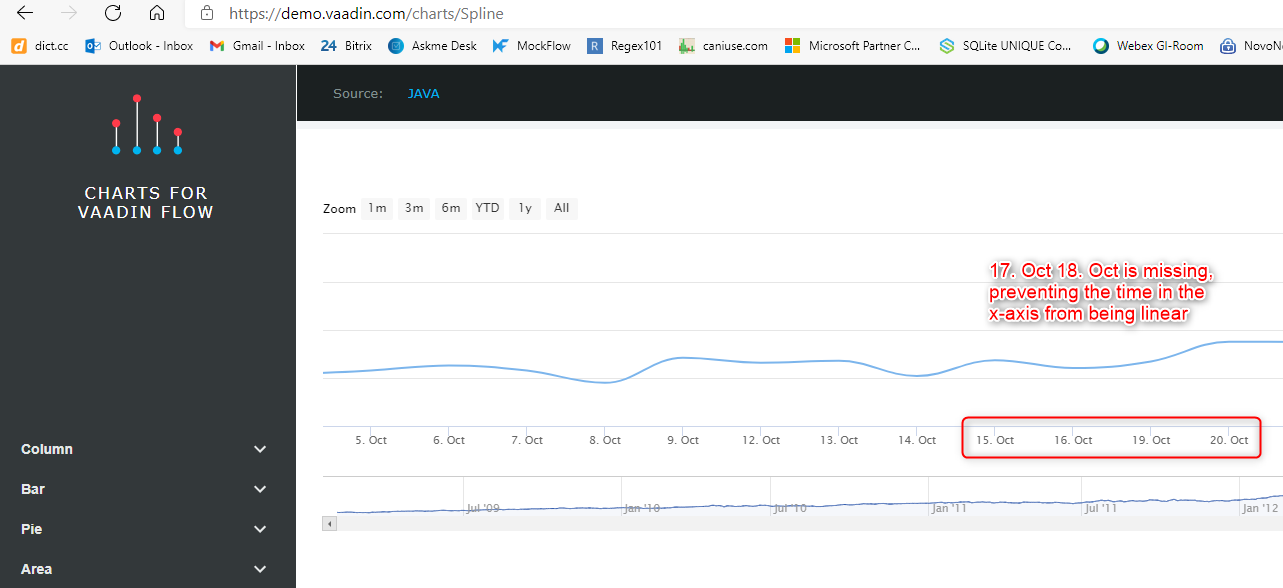
The issue can be shown in the vaadin charts demo with the spline timeline as illustrated in the attached screenshot.
As you can see, time without a data point will not be considered.
What I am trying to achieve is something similar to the sample in the screenshot,
but I want to display events with a linear representation of time in the x-axis.
Does anyone know how this can be achieved?
Thanks, Carsten
Hi,
further investigation on the issue showed that it is required to have a data-point to display a certain time in the chart and that the distance between two data-points is the same.
The workaround that works for me is to add another series to the chart that scales the time to a certain resolution.
The data of this series has data-points to create a uniformly distributed spread across the displayed time range in the chart.
I added data-points according to the required resolution: e.g. every minute/hour/day
This also requires that the resolution of the actual-data series matches the resolution of the “time-scale” series,
meaning that an actual data-point for the time “10:21:35” should be recalculated to “10:21:00” or “10:22:00” to fit into a minute based resolution.
Please let me know if anyone has another idea. Thanks, Carsten