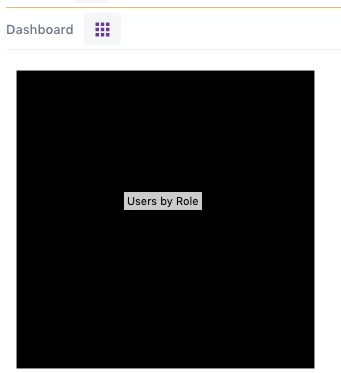
I have tried with many charts and demo charts but always chart only shows a black box. Only works the main tooltip.
Have tried with Safari, Chrome, Firefox & Opera with same results. Browser console doesn’t shows errors.
![Chart issue]
(https://vaadin.com/attachment/00d1f213-8826-430f-b593-eb04251aff44/chart-issue.png)
I am using:
- Vaadin Pro license
- Vaadin 13.0.9
- Spring boot 2.1.4.RELEASE
- Spring 5.1.5.RELEASE
- Java 11
- IntelliJ Community 2019.2
I think that maybe is a style issue. I have some custom styles & colors that works.
But I cant find what I am missing ![]()
This is my main layout class:
@Push
@Viewport("width=device-width, minimum-scale=1.0, initial-scale=1.0, user-scalable=yes")
@HtmlImport("frontend://bower_components/vaadin-lumo-styles/presets/compact.html")
@HtmlImport("frontend://styles/myapp-icons.html")
@HtmlImport("frontend://styles/myapp-letters.html")
@HtmlImport("frontend://styles/myapp-style.html")
@HtmlImport("frontend://styles/shared-styles.html")
@HtmlImport("frontend://styles/dialog-style.html")
@Theme(value = Lumo.class)
public class AppMainLayout extends Div implements RouterLayout, AfterNavigationObserver {
 ...
}
This is myapp-style.html:
<link rel="import" href="../bower_components/polymer/lib/elements/custom-style.html">

<custom-style>
    <style>

    :root {
        --myapp-carbon: rgba(75,75,75,1.0);
        --myapp-yellow: rgba(237, 198, 89, 1.0);
        --myapp-orange: rgba(238, 174, 88, 1.0);
        --myapp-silver: rgba(239,239,244,1.0);
        --myapp-green:  rgba(75,186,194,1.0);
        --myapp-grey:   rgba(143,142,148,1.0);
        --myapp-blue:   rgba(126,161,253,1.0);
        --myapp-purple: rgba(97,46,137,1.0);

        --myapp-main-color: var(--myapp-purple);
        --myapp-main-color-10: rgba(97,46,137,0.1);
        --myapp-main-color-50: rgba(97,46,137,0.5);

        --myapp-alternative-color: var(--myapp-orange);
    }

    </style>
</custom-style>
This is my shared-styles.html:
<dom-module id="shared-styles" theme-for="vaadin-*">
    <template>
        <style include="lumo-color">

        :root {

            --lumo-primary-color: var(--myapp-main-color) !important;
            --lumo-primary-color-10pct: var(--myapp-main-color-10);
            --lumo-primary-color-50pct: var(--myapp-main-color-50);
            --lumo-primary-text-color: var(--myapp-main-color) !important;
        }

        </style>

    </template>
</custom-style>
</dom-module>
This is my chart code (basically demo code):
private void buildUI() {
	VerticalLayoyt chartContainer = new VerticalLayout();
	add(chartContainer);
	chartContainer.add(getDemo());
}
...

private Chart getDemo(){
        Chart chart = new Chart();

        Configuration configuration = chart.getConfiguration();
        configuration.setTitle("Historic World Population by Region");
        configuration.setSubTitle("Source: <a href=\"https://en.wikipedia.org/wiki/World_population\">Wikipedia.org</a>");
        chart.getConfiguration().getChart().setType(ChartType.BAR);

        configuration.addSeries(new ListSeries("Year 1800", 107, 31, 635, 203, 2));
        configuration.addSeries(new ListSeries("Year 1900", 133, 156, 947, 408, 6));
        configuration.addSeries(new ListSeries("Year 2000", 814, 841, 3714, 727, 31));
        configuration.addSeries(new ListSeries("Year 2016", 1216, 1001, 4436, 738, 40));

        XAxis x = new XAxis();
        x.setCategories("Africa", "America", "Asia", "Europe", "Oceania");
        configuration.addxAxis(x);

        YAxis y = new YAxis();
        y.setMin(0);
        AxisTitle yTitle = new AxisTitle();
        yTitle.setText("Population (millions)");
        yTitle.setAlign(VerticalAlign.HIGH);
        y.setTitle(yTitle);
        configuration.addyAxis(y);

        Tooltip tooltip = new Tooltip();
        tooltip.setValueSuffix(" millions");
        configuration.setTooltip(tooltip);

        PlotOptionsBar plotOptions = new PlotOptionsBar();
        DataLabels dataLabels = new DataLabels();
        dataLabels.setEnabled(true);
        plotOptions.setDataLabels(dataLabels);
        configuration.setPlotOptions(plotOptions);

        return chart;
}
Sometimes in log, found this entries:
2019-08-06 19:26:36,051 DEBUG [http-nio-18080-exec-6]
 com.iubo.admin.manager.frontend.util.components.client.ClientTemplate: Client template
2019-08-06 19:26:36,301 WARN  [http-nio-18080-exec-9]
 com.vaadin.flow.server.communication.rpc.AbstractRpcInvocationHandler: Got an RPC for non-existent node: 50
2019-08-06 19:26:36,302 WARN  [http-nio-18080-exec-9]
 com.vaadin.flow.server.communication.rpc.AbstractRpcInvocationHandler: Got an RPC for non-existent node: 50
2019-08-06 19:26:36,303 WARN  [http-nio-18080-exec-9]
 com.vaadin.flow.server.communication.rpc.AbstractRpcInvocationHandler: Got an RPC for non-existent node: 50
2019-08-06 19:26:36,303 WARN  [http-nio-18080-exec-9]
 com.vaadin.flow.server.communication.rpc.AbstractRpcInvocationHandler: Got an RPC for non-existent node: 50
2019-08-06 19:26:36,303 WARN  [http-nio-18080-exec-9]
 com.vaadin.flow.server.communication.rpc.AbstractRpcInvocationHandler: Got an RPC for non-existent node: 50
2019-08-06 19:26:36,304 WARN  [http-nio-18080-exec-9]
 com.vaadin.flow.server.communication.rpc.AbstractRpcInvocationHandler: Got an RPC for non-existent node: 50
2019-08-06 19:26:36,304 WARN  [http-nio-18080-exec-9]
 com.vaadin.flow.server.communication.rpc.AbstractRpcInvocationHandler: Got an RPC for non-existent node: 50
2019-08-06 19:26:36,304 WARN  [http-nio-18080-exec-9]
 com.vaadin.flow.server.communication.rpc.AbstractRpcInvocationHandler: Got an RPC for non-existent node: 50
2019-08-06 19:26:36,305 WARN  [http-nio-18080-exec-9]
 com.vaadin.flow.server.communication.rpc.AbstractRpcInvocationHandler: Got an RPC for non-existent node: 50
2019-08-06 19:26:36,305 WARN  [http-nio-18080-exec-9]
 com.vaadin.flow.server.communication.rpc.AbstractRpcInvocationHandler: Got an RPC for non-existent node: 50
2019-08-06 19:26:36,522 DEBUG [http-nio-18080-exec-5]
 com.iubo.admin.manager.frontend.util.components.client.ClientTemplate: Client info received: Mozilla/5.0 (Macintosh; Intel Mac OS X 10_14_5) AppleWebKit/537.36 (KHTML, like Gecko) Chrome/75.0.3770.142 Safari/537.36|en-US|1375|917|1920|1080