Hi there,
I am facing a performance problem with our Web app using Vaadin and d3 as library to display barcharts on a dashboard.
Let me describe the scenario:
We have implemented a dashboard for our web app and as it is with many web apps the dashboard is often the first thing a user sees when logging into the app.
Now the dashboard may also contain components showing barchart reports. We use wrapper component that acts as bridge to the actual chart. And the charts are drawn via the d3 library.
Until login click from the login page to the fully available web ui and dashboard this takes around 6 seconds on productive system.
This may not sound much, but from a user experience point of view this looks bad, since during that time, nothing is shown except for blank background and a loading indicator and of course the whole web app is not responsive to user actions. And this looks worse as this is the first thing experienced as user.
I checked and verified in many ways that the loading of the data from the server is not the cause.
Also when initially entering the web app using another dashboard that does NOT use such barcharts, the loading time shrinks to 1-2 secs.
And finally, let’s say we have two dashboards with each a barchart. Dashboard 1 uses a barchart referring to data source 1 and the other dashboard 2 to data source 2. Logging in to web app using dashboard 1 as initial dashboard needs 5-6 seconds as already stated. But when switching to dashboard 2 loading time is down to 1 sec again.
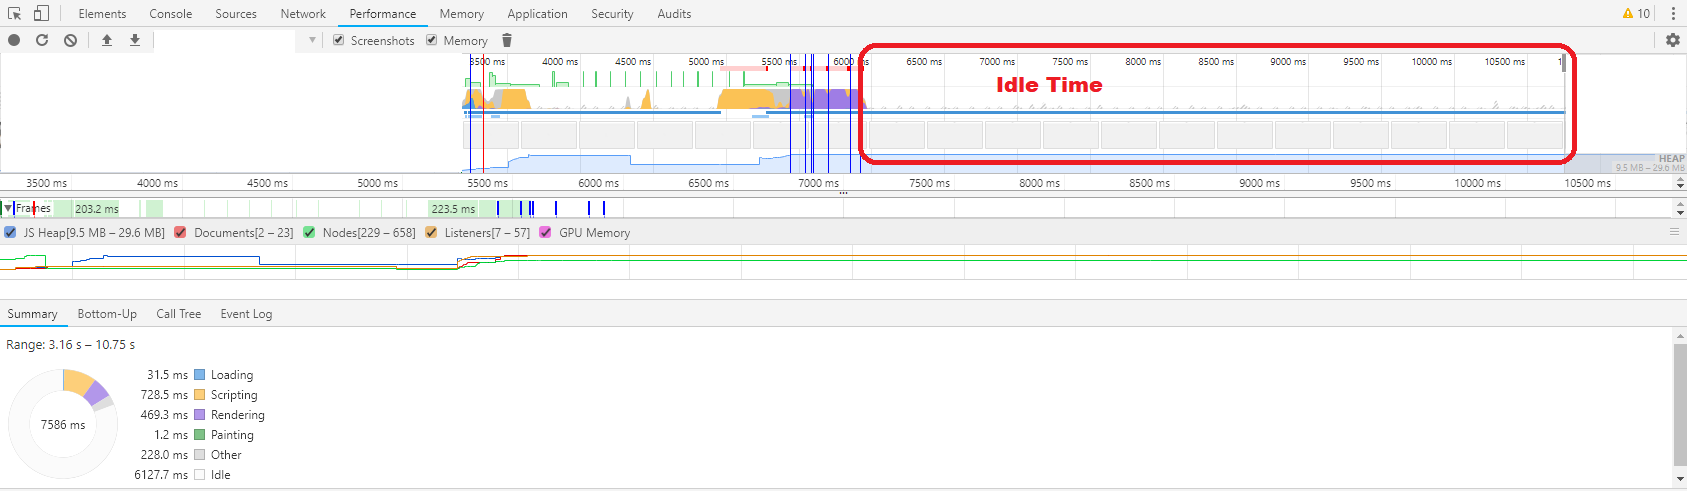
When looking at the recorded performance via Chrome performance tab, I noted that there is a gap of around up to 4 seconds between last activity of browser (rendering, scripting…) and the final visibility and responsiveness of the web app - see attached screen “PerformanceMeasurementBrowser.png”. That gap is marked as “idle time” by the browser performance measurement. I have seen that idle time on other occasions, but it was no way as high as up to 4 sec.
I noted as well that the components wrapping the charts are a Vaadin CustomComponent as opposed to others which are e.g. simple VerticalLayouts which did not have those high loading times. I tried to switch from CustomComponent to VerticalLayout for the barcharts but this was to no avail.
Another thing: we generally do not rule out Vaadin Charts as an option. But this will of course need further effort to exchange d3 with Vaadin Charts and we currently do not have a proper license anyway to use Vaadin Charts.
Now the questions are:
- what is the best way to debug this problem further both on client and server side (especially finding out why that “idle time” is so big). Are there typical requests or events one has to look for? Requests to VaadinBootstrap? xhr requests to widgetset, requests to /UIDL etc.?
- how this is related to Vaadin if related at all considering useage of d3 as chart library. Maybe someone else uses Vaadin with d3 as well and has some sort of best practices and pitfalls to avoid.
- where to find more general guidelines to improve initial loading times
Used versions:
Vaadin: 7.7.9
d3: 3.4.1
nv d3: 1.1.15b
Chrome: 71.0.3578.98 (Official Build) (64-bit)
Regards