Hello Team,
I have one vaadin-flow bubble chart (Version-6.1.0).
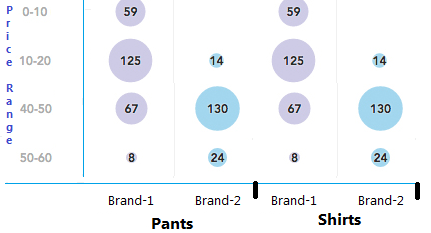
I need to display data for different-different brands which needs to be grouped by categories.
Please refers to attached screen-shot for more understanding.
How can we achieve this?
Please Help.