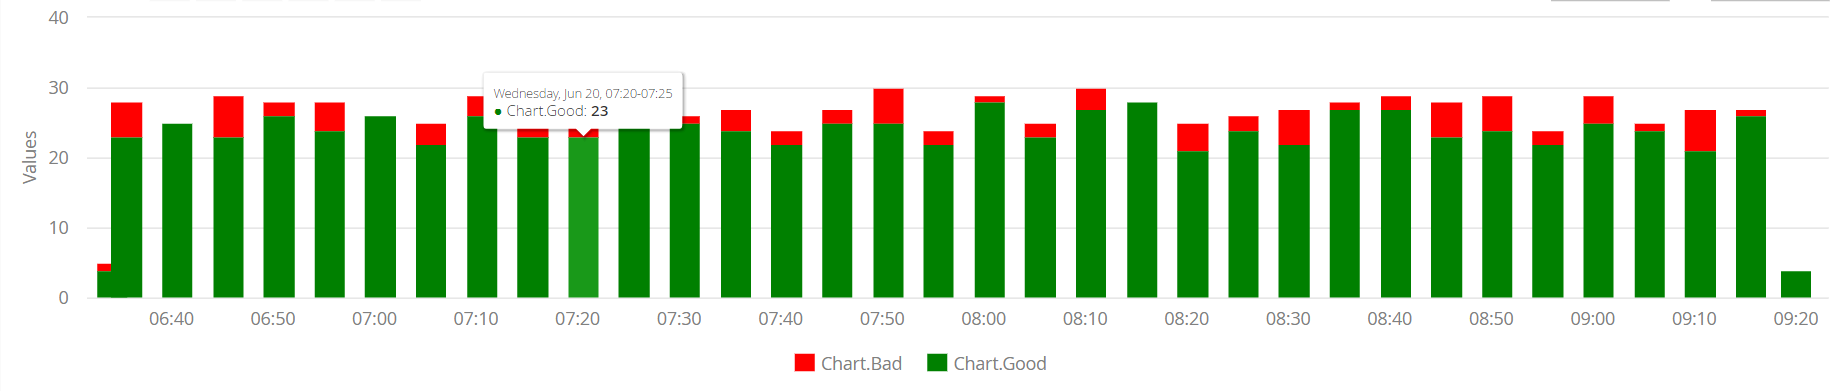
I’m using Vaadin Charts to display points from production data, each consisting of a timestamp and a group they belong to (like good, faulty, skipped). Since it is not fix how many points fall into a time interval, it is important to show the total amount of points per interval.
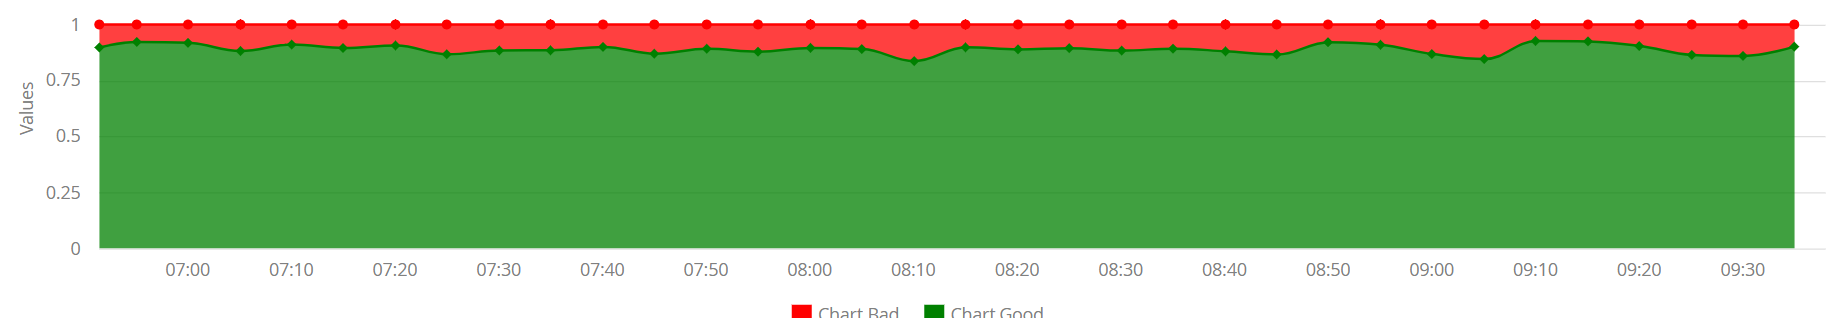
This works fine when using columns in compination with DataGrouping, but as soon as I use area spline/ scatter etc. it uses the average, which always amounts to 1 instead of anything representing the amount per interval. (see attached pictures to compare)
Is it possible to let spline graphs group by sum instead of average?