Print axis and legend in Multiple axis chart

Hi,
I’m using Vaadin 10 to develop a simple chart in my company.
I created a multiple axis chart where I have 3 y axis and it’s legend correctly.

I know that there is the possibility to set the y axis color using y.setClassName("red-colored")
What I need is to understand if there is the possibility (and how) to print the axis in accordion with its legend.

The next step will we to hide the axis with the legend when I click on it :slight_smile:

Thanks a lot
Gianluca

About this part:

The next step will we to hide the axis with the legend when I click on it :slight_smile:

Do you want to hide the axis when you click on the legend or vice-versa?
If the series is linked to the axis then the axis will be hidden when you hide the series by clicking in the legend, you can see this behavior in this demo https://charts.demo.vaadin.com/MultipleAxes
But I’m not sure that’s what you want.

Thanks for your answer.
I’d like to be able to hide the axis (and legend too) clicking on it.
Currently I know that is possible to hide the axis clicking on the legend even if the axis Title is always visible.

So my first step is print the axis in accordion with the legend, and using MultipleAxis example I can see that using

:host(.**MultipleAxes**) .highcharts-color-0, .y2 {
        fill: #3090f0;
        stroke: #3090f0;
      }

code in the stype the axis is showed as I require.
Thanks for it.

The axis titles instead are always in the same color. Is there a trick or something else that I can use to show the axis title with the same color? Do you know why, clicking on legend, the axis title does not disappear?

Thanks

To be able to hide the axis clicking on it is a nice to have :slight_smile:
Please can you help me??

Thanks
Gianluca

About the axis title color, if you check MultipleAxes it’s setting the class y1 and y2 to the axes.
If you have the same then a selector like .y2 text should do the trick:

:host(.**MultipleAxes**) .highcharts-color-0, .y2, .y2 text {
  fill: #3090f0;
  stroke: #3090f0;
}

Regarding the axis title not being hidden I think it’s a Highcharts issue, I’ll take a look.

Hi Guillermo,
thanks a lot. Your trick works very fine!! Now I can show the axis title as I need!!

Let me know if you find something about the problem about the axis name that should hide.
Can I ask you another question?
Can you tell me if is possible, using MultipleAxis chart, remove the square or triangle that are visible on the line?

Thanks
Gianluca

Hi Guillermo,
I think I found I bug in multiple axis chart.

When I set the min value for a Y axis, it does not hide when I click on it’s legend.
Removing the min value the behavior become as we known.

How I could notify this issue?
Gianluca

Can I ask you another question? Can you tell me if is possible, using MultipleAxis chart, remove the square or triangle that are visible on the line?

Those markers (square, triangle, circle) can be disabled with the following code:

plotOptionsSpline.getMarker().setEnabled(false);

After that the markers still shown when you hover on the points, to disable the hovering behavior you can do the following:

plotOptionsSpline.getStates().getHover().setEnabled(false);

When I set the min value for a Y axis, it does not hide when I click on it’s legend. Removing the min value the behavior become as we known.

I wasn’t able to reproduce this, I tested with the MultipleAxes sources setting a min for every axis, and it was still hidden when the series was hidden by clicking the legend.

If this is still an issue, you can report it github https://github.com/vaadin/vaadin-charts-flow/issues/new

Don’t forget to mention which Vaadin 10 version you’re using and include an minimal example of configuration to reproduce the issue

Let me know if you find something about the problem about the axis name that should hide.

This seems to be an issue in the underlying charting library, I just reported it in Highcharts https://github.com/highcharts/highcharts/issues/8249

Guillermo Alvarez:

When I set the min value for a Y axis, it does not hide when I click on it’s legend. Removing the min value the behavior become as we known.

I wasn’t able to reproduce this, I tested with the MultipleAxes sources setting a min for every axis, and it was still hidden when the series was hidden by clicking the legend.

If this is still an issue, you can report it github https://github.com/vaadin/vaadin-charts-flow/issues/new

Don’t forget to mention which Vaadin 10 version you’re using and include an minimal example of configuration to reproduce the issue

Thanks a lot.
Currently I’m using the Code coming from Vaadin Demo that use Flow and Spring.
I just upgrade the Vaadin version from 10.0.0.beta3 to 10.0.0.beta8 that include vaadin-charts-flow-6.0.0.beta2 but I continue to have the same problems.

Adding the min value the axis does not disappear.
Removing it, the axis disappear when I click on its legend.

                y = new YAxis();
				y.setClassName("y4");
				y.setTitle(new AxisTitle("Y4!!"));
				y.setTickAmount(5);
				y.setDescription("My description");
				y.setMax(max);
				y.setMin(min);
				conf.addyAxis(y);

Are you using the same chart version?
How I can update it?

Thanks
Gianluca

Regarding hiding the title I just noticed about the showEmpty API, if you do y.setShowEmpty(false); then the axis labels and the title are removed.

This doesn’t fix the situation when both min and max are set, like in your last code snippet, if you only set min or max it should work.

Behavior with min and max is explained in this [highcharts issue]
(https://github.com/highcharts/highcharts/issues/705#issuecomment-92805421)

If using softMin and softMax (https://demo.vaadin.com/javadoc/com.vaadin/vaadin-charts-flow/6.0.0.beta2/com/vaadin/flow/component/charts/model/YAxis.html#getSoftMax--) is enough for you, then showEmpty works as expected when setting both of them.

I modified MultipleAxes demo to define axes as follows and it now behaves as you wanted:

YAxis y1 = new YAxis();
y1.setTitle(new AxisTitle("Temperature"));
Labels labels = new Labels();
labels.setFormatter("return this.value +'°C'");
y1.setLabels(labels);
y1.setOpposite(true);
y1.setClassName("y1");
y1.setSoftMin(0);
y1.setSoftMax(35);
y1.setShowEmpty(false);
conf.addyAxis(y1);

YAxis y2 = new YAxis();
y2.setTitle(new AxisTitle("Rainfall"));
labels = new Labels();
labels.setFormatter("return this.value +' mm'");
y2.setLabels(labels);
y2.setSoftMin(-50);
y2.setSoftMax(300);
y2.setShowEmpty(false);
y2.setClassName("y2");
conf.addyAxis(y2);

YAxis y3 = new YAxis();
y3.setTitle(new AxisTitle("Sea-Level Pressure"));
labels = new Labels();
labels.setFormatter("return this.value +' mb'");
y3.setLabels(labels);
y3.setSoftMin(1000);
y3.setSoftMax(1035);
y3.setShowEmpty(false);
y3.setOpposite(true);
y3.setClassName("y3");
conf.addyAxis(y3);

Hi Guillermo,
I tried to use setSoftMax/setSoftMax but it does not have the desired effect. The chart, infact from the correct view:

[origin.PNG]

become

[new.PNG]

that I attached.

with softMin/max and y.setShowEmpty(false), the axis and legend disappear.
I need to set the max and min because without this instructions the X Axis is printed wrongly

17062143.png
17062146.png

Hi Guillermo,
I tried your code and I what I can see is that setSoftMax(Min) works fine only if you have 2 Y axis.
Adding another one the chart is showed not correctly.
What I can see is that for the 3 Y axis the X axis is not painted well.

I post my code so that you can validate my test:


		Chart chart = new Chart();
		Configuration conf = chart.getConfiguration();

		conf.getChart().setZoomType(Dimension.XY);
		conf.setTitle("My math functions");
		conf.setSubTitle("Source: WorChartDemo");

		XAxis x = new XAxis();
		x.setCategories("0", "π/4", "π/2", "3π/4", "π", "5π/4", "3π/2", "7π/4", "2π");
		conf.addxAxis(x);

		YAxis y1 = new YAxis();
		y1.setTitle(new AxisTitle("Sin"));
		Labels labels = new Labels();
		labels.setFormatter("return this.value +' '");
		y1.setLabels(labels);
		y1.setClassName("y1");
		y1.setSoftMin(-1);
		y1.setSoftMax(1);
		y1.setShowEmpty(false);
		conf.addyAxis(y1);

		YAxis y2 = new YAxis();
		y2.setTitle(new AxisTitle("Cos"));
		labels = new Labels();
		labels.setFormatter("return this.value +' '");
		y2.setLabels(labels);
		y2.setSoftMin(-1);
		y2.setSoftMax(1);
		y2.setShowEmpty(false);
		y2.setClassName("y2");
		conf.addyAxis(y2);

		YAxis y3 = new YAxis();
		y3.setTitle(new AxisTitle("Puff"));
		labels = new Labels();
		labels.setFormatter("return this.value +' o'");
		y3.setLabels(labels);
		y3.setSoftMin(-3);
		y3.setSoftMax(3);
		y3.setShowEmpty(false);
		y3.setOpposite(true);
		y3.setClassName("y3");
		conf.addyAxis(y3);

		Legend legend = new Legend();
		legend.setLayout(LayoutDirection.VERTICAL);
		legend.setAlign(HorizontalAlign.LEFT);
		legend.setX(120);
		legend.setVerticalAlign(VerticalAlign.TOP);
		legend.setY(80);
		legend.setFloating(true);
		conf.setLegend(legend);

		DataSeries series = new DataSeries();
		PlotOptionsSpline plotOptionsColumn = new PlotOptionsSpline();
		series.setPlotOptions(plotOptionsColumn);
		series.setName("Sin");
		series.setyAxis(0);
		series.setData(0, 0.707, 1, 0.707, 0, -0.707, -1, -0.707, 0);
		conf.addSeries(series);

		series = new DataSeries();
		PlotOptionsSpline plotOptionsSpline = new PlotOptionsSpline();
		series.setPlotOptions(plotOptionsSpline);
		series.setName("Cos");
		series.setyAxis(1);
		// series.setData(1016, 1016, 1015.9, 1015.5, 1012.3, 1009.5, 1009.6, 1010.2, 1013.1, 1016.9, 1018.2, 1016.7);
		series.setData(1, 0.707, 0, -0.707, -1, -0.707, 0, 0.707, 1);
		conf.addSeries(series);

		series = new DataSeries();
		plotOptionsSpline = new PlotOptionsSpline();
		series.setPlotOptions(plotOptionsSpline);
		series.setName("Puff");
		series.setData(0, 1.5, 0.5, 1.5, 1.2, 2.5, 2.2, 2.5, 2.3);
		series.setyAxis(2);
		conf.addSeries(series);
		

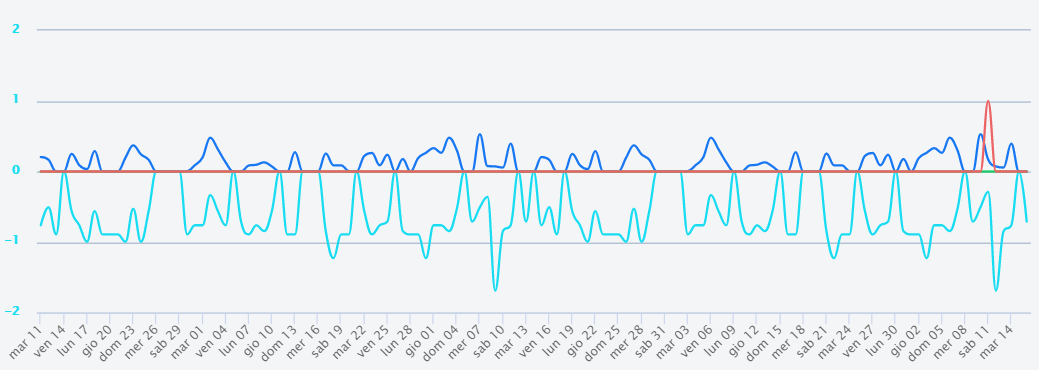
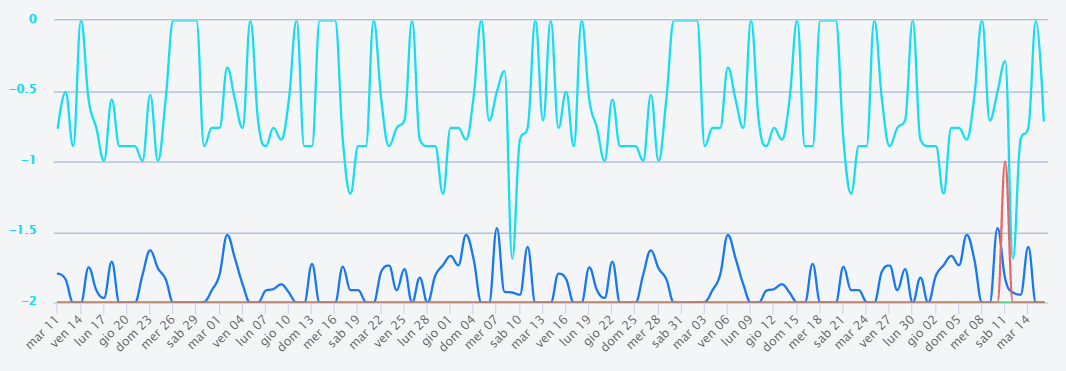
As you can see the Y3 axis should start with 0 and it is correct looking the chart.
But the horizontal axis is not printed in the correct way (is good for the Y1 and Y2 instead)

To fix this behavior you need to set Max and Min (no SoftMax and SoftMin). But after that the axis will not disapprear
if you click on the legend.

Let me know what do you think about.
Thanks
Gianluca

Hi Guillermo,
do you have some news about my issue?

Thanks