I used the following to set the X Axis labels
// Set the X Axis labels
configuration.getxAxis().setCategories(“'17 Jan”, “'17 Feb”, “'17 Mar”, “'17 Apr”,
“'17 May”, “'17 Jun”, “'17 Jul”, “'17 Aug”, “'17 Sep”, “'17 Oct”, “'17 Nov”, “'17 Dec”);
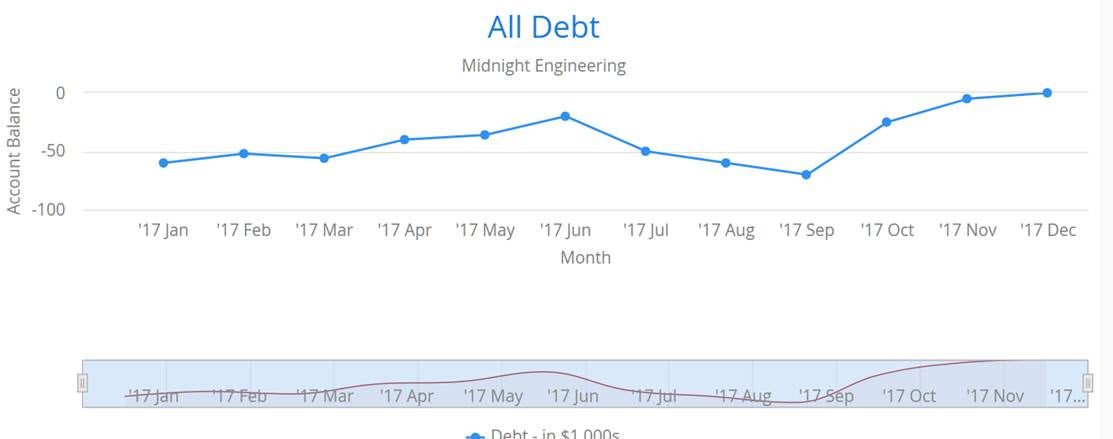
When I use a date string the labels display ok,
series.add(new DataSeriesItem(“2017-01-01”, -60));
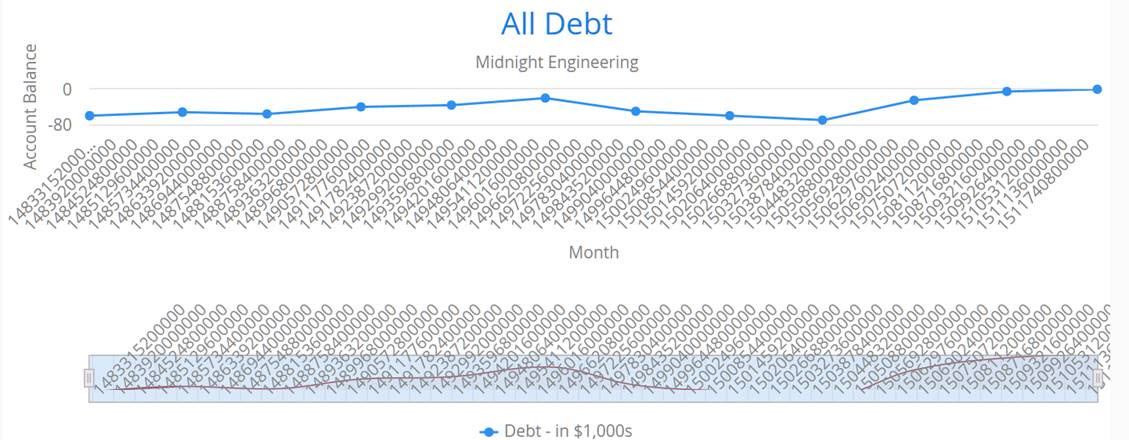
But when I use an Instant value the labels display like a long integer.
series.add(new DataSeriesItem(LocalDate.parse(“2017-01-01”, dtf).atStartOfDay().toInstant(ZoneOffset.UTC),-60));
What is the correct way to initialize date values for the X Axis?
Thanks,
Valon
Please see the attached images with a good display and a bad display. THe module’s code is below. .
package com.valon.StatManager;
import java.io.IOException;
import java.text.DateFormat;
import java.text.ParseException;
import java.text.SimpleDateFormat;
import java.time.Instant;
import java.time.LocalDate;
import java.time.ZoneOffset;
import java.time.format.DateTimeFormatter;
import java.util.Date;
/*
import java.util.logging.FileHandler;
import java.util.logging.Handler;
import java.util.logging.Level;
import java.util.logging.Logger;
*/
import org.slf4j.Logger;
import org.slf4j.LoggerFactory;
import javax.servlet.annotation.WebServlet;
import com.valon.StatManager.ChartsData.BalanceInfo;
import com.valon.StatManager.ChartsData.WeatherInfo;
import com.vaadin.addon.charts.Chart;
import com.vaadin.addon.charts.model.AxisType;
import com.vaadin.addon.charts.model.ChartType;
import com.vaadin.addon.charts.model.Configuration;
import com.vaadin.addon.charts.model.DataProviderSeries;
import com.vaadin.addon.charts.model.DataSeries;
import com.vaadin.addon.charts.model.DataSeriesItem;
import com.vaadin.addon.charts.model.PlotOptionsLine;
import com.vaadin.addon.charts.model.PlotOptionsSeries;
import com.vaadin.addon.charts.model.style.SolidColor;
import com.vaadin.annotations.Theme;
import com.vaadin.annotations.VaadinServletConfiguration;
import com.vaadin.data.provider.ListDataProvider;
import com.vaadin.navigator.Navigator;
import com.vaadin.server.VaadinRequest;
import com.vaadin.server.VaadinServlet;
/*
import com.vaadin.ui.Button;
import com.vaadin.ui.Label;
import com.vaadin.ui.TextField;
*/
import com.vaadin.ui.UI;
import com.vaadin.ui.VerticalLayout;
/**
-
This UI is the application entry point. A UI may either represent a browser window
-
(or tab) or some part of an HTML page where a Vaadin application is embedded.
-
-
The UI is initialized using {@link #init(VaadinRequest)}. This method is intended to be
-
overridden to add component to the user interface and initialize non-component functionality.
*/
@Theme(“mytheme”)
public class MyUI extends UI {
// TODO Add a logging framework.
// private static final Logger logger = Logger.getLogger( Class.class.getName() );private static final long serialVersionUID = 1L;
private static final DateTimeFormatter dtf = DateTimeFormatter.ofPattern(“yyyy-MM-dd”);@Override
protected void init(VaadinRequest vaadinRequest) {
/*
// Default UI from artifact.
final VerticalLayout layout = new VerticalLayout();final TextField name = new TextField(); name.setCaption("Type your name here:"); Button button = new Button("Click Me"); button.addClickListener(e -> { layout.addComponent(new Label("Thanks " + name.getValue() + ", it works!")); }); layout.addComponents(name, button); setContent(layout); */ final VerticalLayout layout = new VerticalLayout(); layout.setMargin(true); setContent(layout); ChartsData data = new ChartsData(); // layout.addComponent(getBalanceChart(layout, data)); // layout.addComponent(getWeatherChart(layout, data)); // layout.addComponent(getBalanceChart(layout, data)); layout.addComponent(getSingleDebtChart(layout, data)); return;}
@SuppressWarnings({ “unused”, “deprecation” })
private Chart getSingleDebtChart(VerticalLayout layout, ChartsData data) {
Chart chart = new Chart();
Configuration configuration = chart.getConfiguration();
configuration.setTitle(“All Debt”); // Good candidate for a stacked bar chart.
configuration.setSubTitle(“Midnight Engineering”);configuration.getChart().setType(ChartType.LINE); DataSeries series = new DataSeries(); series.setName("Debt - in $1,000s"); // Set the X Axis labels configuration.getxAxis().setCategories("'17 Jan", "'17 Feb", "'17 Mar", "'17 Apr", "'17 May", "'17 Jun", "'17 Jul", "'17 Aug", "'17 Sep", "'17 Oct", "'17 Nov", "'17 Dec"); /* // Works */ series.add(new DataSeriesItem("2017-01-01", -60)); series.add(new DataSeriesItem("2017-02-01", -52)); series.add(new DataSeriesItem("2017-03-01", -56)); series.add(new DataSeriesItem("2017-04-01", -40)); series.add(new DataSeriesItem("2017-05-01", -36)); series.add(new DataSeriesItem("2017-06-01", -20)); series.add(new DataSeriesItem("2017-07-01", -50)); series.add(new DataSeriesItem("2017-08-01", -60)); series.add(new DataSeriesItem("2017-09-01", -70)); series.add(new DataSeriesItem("2017-10-01", -25)); series.add(new DataSeriesItem("2017-11-01", -5)); series.add(new DataSeriesItem("2017-12-01", -0)); /* // Does not work. Instant instant; String dateStr; instant = LocalDate.parse("2017-12-01", dtf).atStartOfDay().toInstant(ZoneOffset.UTC); System.out.println("instant.toString() = " + instant.toString()); series.add(new DataSeriesItem(LocalDate.parse("2017-01-01", dtf).atStartOfDay().toInstant(ZoneOffset.UTC), -60)); series.add(new DataSeriesItem(LocalDate.parse("2017-02-01", dtf).atStartOfDay().toInstant(ZoneOffset.UTC), -52)); series.add(new DataSeriesItem(LocalDate.parse("2017-01-01", dtf).atStartOfDay().toInstant(ZoneOffset.UTC), -60)); series.add(new DataSeriesItem(LocalDate.parse("2017-02-01", dtf).atStartOfDay().toInstant(ZoneOffset.UTC), -52)); series.add(new DataSeriesItem(LocalDate.parse("2017-03-01", dtf).atStartOfDay().toInstant(ZoneOffset.UTC), -56)); series.add(new DataSeriesItem(LocalDate.parse("2017-04-01", dtf).atStartOfDay().toInstant(ZoneOffset.UTC), -40)); series.add(new DataSeriesItem(LocalDate.parse("2017-05-01", dtf).atStartOfDay().toInstant(ZoneOffset.UTC), -36)); series.add(new DataSeriesItem(LocalDate.parse("2017-06-01", dtf).atStartOfDay().toInstant(ZoneOffset.UTC), -20)); series.add(new DataSeriesItem(LocalDate.parse("2017-07-01", dtf).atStartOfDay().toInstant(ZoneOffset.UTC), -50)); series.add(new DataSeriesItem(LocalDate.parse("2017-08-01", dtf).atStartOfDay().toInstant(ZoneOffset.UTC), -60)); series.add(new DataSeriesItem(LocalDate.parse("2017-09-01", dtf).atStartOfDay().toInstant(ZoneOffset.UTC), -70)); series.add(new DataSeriesItem(LocalDate.parse("2017-10-01", dtf).atStartOfDay().toInstant(ZoneOffset.UTC), -25)); series.add(new DataSeriesItem(LocalDate.parse("2017-11-01", dtf).atStartOfDay().toInstant(ZoneOffset.UTC), -5)); series.add(new DataSeriesItem(LocalDate.parse("2017-12-01", dtf).atStartOfDay().toInstant(ZoneOffset.UTC), -0)); */ /* -------------------------------------------------------------------- */ configuration.addSeries(series); configuration.getxAxis().setTitle("Month"); configuration.getxAxis().setType(AxisType.DATETIME); configuration.getyAxis().setTitle("Account Balance"); // Add the time range navigator to the chart. // TODO Try the Range selector when have more data // https://vaadin.com/docs/v8/charts/java-api/charts-timeline.html com.vaadin.addon.charts.model.Navigator navigator = configuration.getNavigator(); navigator.setEnabled(true); navigator.setMargin(75); PlotOptionsSeries plotOptions=new PlotOptionsSeries(); plotOptions.setColor(SolidColor.BROWN); navigator.setSeries(plotOptions); // Add the same X Axis labels. // TODO X Axis labels: Assign from a string array or assign in a loop. navigator.getXAxis().setCategories("'17 Jan", "'17 Feb", "'17 Mar", "'17 Apr", "'17 May", "'17 Jun", "'17 Jul", "'17 Aug", "'17 Sep", "'17 Oct", "'17 Nov", "'17 Dec"); return chart;}
@SuppressWarnings(“unused”)
private Chart getBalanceChart(VerticalLayout layout, ChartsData data) {
Chart chart = new Chart();
Configuration conf = chart.getConfiguration();
conf.setTitle(“Cash Bills”);
conf.setSubTitle(“Midnight Engineering”);conf.getChart().setType(ChartType.LINE); ListDataProvider<BalanceInfo> dataProvider = new ListDataProvider<>(data.getBalanceData()); DataProviderSeries<BalanceInfo> temp = new DataProviderSeries<>(dataProvider); temp.setName("Balance"); temp.setX(BalanceInfo::getDate); temp.setY(BalanceInfo::getBalance); /* conf.addSeries(temp); // Not working. */ conf.getxAxis().setTitle("Date"); conf.getxAxis().setType(AxisType.DATETIME); conf.getyAxis().setTitle("Account Balance"); return chart;}
@SuppressWarnings(“unused”)
private Chart getWeatherChart(VerticalLayout layout, ChartsData data) {
Chart chart = new Chart();
Configuration conf = chart.getConfiguration();
conf.setTitle(“Turku, Finland 2013”);conf.getChart().setType(ChartType.LINE); ListDataProvider<WeatherInfo> dataProvider = new ListDataProvider<>(data.getWeatherData()); DataProviderSeries<WeatherInfo> temp = new DataProviderSeries<>(dataProvider); temp.setName("Temperature"); temp.setX(WeatherInfo::getInstant); temp.setY(WeatherInfo::getMaxTemp); conf.addSeries(temp); conf.getxAxis().setTitle("Date"); conf.getxAxis().setType(AxisType.DATETIME); conf.getyAxis().setTitle("Temperature (°C)"); return chart;}
@SuppressWarnings(“unused”)
private Chart getShoeSizeChart(VerticalLayout layout, ChartsData data) {
Chart chart = new Chart();
layout.addComponent(chart);Configuration conf = chart.getConfiguration(); conf.setTitle("Hello Stats Manager - Your First Chart!"); conf.getChart().setType(ChartType.LINE); // Add Girls Shoe Size Data Series DataSeries girls = new DataSeries("Girls"); for(ChartsData.ShoeSizeInfo shoeSizeInfo : data.getGirlsData()) { // Shoe size on the X-axis, age on the Y-axis girls.add(new DataSeriesItem( shoeSizeInfo.getSize(), shoeSizeInfo.getAgeMonths()/12.0f)); } conf.addSeries(girls); // Add labels to X and Y Axis. conf.getxAxis().setTitle("Shoe size (EU)"); conf.getyAxis().setTitle("Age (Years)"); // Add Boys Shoe Size Data Series DataSeries boys = new DataSeries("Boys"); for(ChartsData.ShoeSizeInfo shoeSizeInfo : data.getBoysData()) { // Shoe size on the X-axis, age on the Y-axis boys.add(new DataSeriesItem( shoeSizeInfo.getSize(), shoeSizeInfo.getAgeMonths()/12.0f)); } conf.addSeries(boys); // Configure the chart line colors. PlotOptionsLine girlsOpts = new PlotOptionsLine(); girlsOpts.setColor(SolidColor.HOTPINK); girls.setPlotOptions(girlsOpts); PlotOptionsLine boysOpts = new PlotOptionsLine(); boysOpts.setColor(SolidColor.BLUE); boys.setPlotOptions(boysOpts); return chart;}
@WebServlet(urlPatterns = “/*”, name = “MyUIServlet”, asyncSupported = true)
@VaadinServletConfiguration(ui = MyUI.class, productionMode = false)
public static class MyUIServlet extends VaadinServlet {
private static final long serialVersionUID = 1L;
}
}


