Rey
(Rey Rey)
1
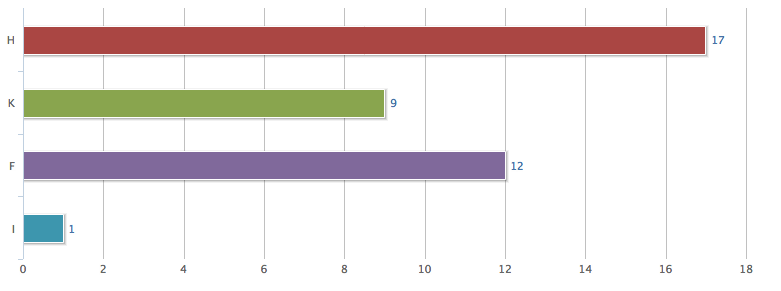
Please I need create a bar series chart like the image, can you help me!.
I tried wit this part of code but don’t work!
  InvientChartsConfig chartConfig = new InvientChartsConfig();
        chartConfig.getGeneralChartConfig().setType(InvientCharts.SeriesType.BAR);

////////////////

 xAxis.setCategories(Arrays.asList("H", "K", "F", "I" ));
        LinkedHashSet<InvientChartsConfig.XAxis> xAxesSet = new LinkedHashSet<InvientChartsConfig.XAxis>();
        xAxesSet.add(xAxis);
        chartConfig.setXAxes(xAxesSet);

///////////////

InvientCharts.XYSeries seriesData = new InvientCharts.XYSeries("H");
        seriesData.setSeriesPoints(getPoints(seriesData, 17));
        chart.addSeries(seriesData);
         seriesData = new InvientCharts.XYSeries("K");
        seriesData.setSeriesPoints(getPoints(seriesData, 9));
        chart.addSeries(seriesData);
         seriesData = new InvientCharts.XYSeries("F");
        seriesData.setSeriesPoints(getPoints(seriesData, 12));
        chart.addSeries(seriesData);
        seriesData = new InvientCharts.XYSeries("I");
        seriesData.setSeriesPoints(getPoints(seriesData, 1));
        chart.addSeries(seriesData);
Javier1
(Javier Serrano)
2
Hi,
Checking the sources of InvientCharts samples hosted in github you can see the creation of a Bar Series Chart. I paste the code here:
    private void showBarBasic() {
        InvientChartsConfig chartConfig = new InvientChartsConfig();
        chartConfig.getGeneralChartConfig().setType(SeriesType.BAR);

        chartConfig.getTitle().setText("Historic World Population by Region");
        chartConfig.getSubtitle().setText("Source: Wikipedia.org");

        CategoryAxis xAxisMain = new CategoryAxis();
        List<String> categories = Arrays.asList("Africa", "America", "Asia",
                "Europe", "Oceania");
        xAxisMain.setCategories(categories);
        LinkedHashSet<XAxis> xAxesSet = new LinkedHashSet<InvientChartsConfig.XAxis>();
        xAxesSet.add(xAxisMain);
        chartConfig.setXAxes(xAxesSet);

        NumberYAxis yAxis = new NumberYAxis();
        yAxis.setMin(0.0);
        yAxis.setTitle(new AxisTitle("Population (millions)"));
        yAxis.getTitle().setAlign(AxisTitleAlign.HIGH);
        LinkedHashSet<YAxis> yAxesSet = new LinkedHashSet<InvientChartsConfig.YAxis>();
        yAxesSet.add(yAxis);
        chartConfig.setYAxes(yAxesSet);

        chartConfig
                .getTooltip()
                .setFormatterJsFunc(
                        "function() {"
                                + " return '' + this.series.name +': '+ this.y +' millions';"
                                + "}");

        BarConfig barCfg = new BarConfig();
        barCfg.setDataLabel(new DataLabel());
        chartConfig.addSeriesConfig(barCfg);

        Legend legend = new Legend();
        legend.setLayout(Layout.VERTICAL);
        legend.setPosition(new Position());
        legend.getPosition().setAlign(HorzAlign.RIGHT);
        legend.getPosition().setVertAlign(VertAlign.TOP);
        legend.getPosition().setX(-100);
        legend.getPosition().setY(100);
        legend.setFloating(true);
        legend.setBorderWidth(1);
        legend.setBackgroundColor(new RGB(255, 255, 255));
        legend.setShadow(true);
        chartConfig.setLegend(legend);

        chartConfig.getCredit().setEnabled(false);

        InvientCharts chart = new InvientCharts(chartConfig);

        XYSeries seriesData = new XYSeries("Year 1800");
        seriesData.setSeriesPoints(getPoints(seriesData, 107, 31, 635, 203, 2));
        chart.addSeries(seriesData);

        seriesData = new XYSeries("Year 1900");
        seriesData
                .setSeriesPoints(getPoints(seriesData, 133, 156, 947, 408, 6));
        chart.addSeries(seriesData);

        seriesData = new XYSeries("Year 2008");
        seriesData.setSeriesPoints(getPoints(seriesData, 973, 914, 4054, 732,
                34));
        chart.addSeries(seriesData);

        addChart(chart);

    }
You can see the code here
https://github.com/invient-cp/InvientCharts
.
HTH.
Javi.
Rey
(Rey Rey)
3
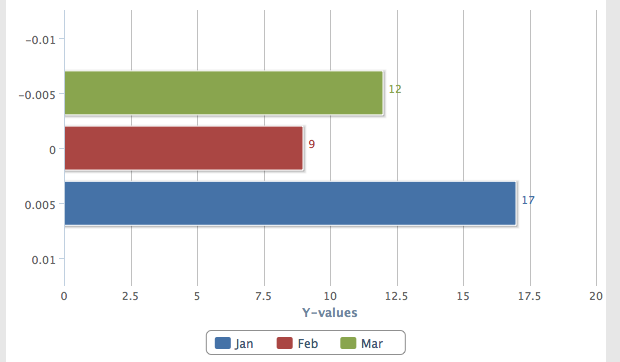
Thank Javier,
but I have another problem, I need show labels on the left side of the bars (see the image), my code is:
        InvientChartsConfig.BarConfig barConfig = new InvientChartsConfig.BarConfig();
        barConfig.setAnimation(true);
        barConfig.setDataLabel(new InvientChartsConfig.DataLabel(true));
        barConfig.setAllowPointSelect(true);
        barConfig.setShowInLegend(true);

        InvientChartsConfig chartConfig = new InvientChartsConfig();
        chartConfig.getGeneralChartConfig().setType(InvientCharts.SeriesType.BAR);

        InvientCharts chart = new InvientCharts(chartConfig);

        InvientCharts.XYSeries seriesData = new InvientCharts.XYSeries("Jan", barConfig);
        seriesData.setSeriesPoints(getPoints(seriesData, 17));
        chart.addSeries(seriesData);

        seriesData = new InvientCharts.XYSeries("Feb", barConfig);
        seriesData.setSeriesPoints(getPoints(seriesData, 9));
        chart.addSeries(seriesData);

        seriesData = new InvientCharts.XYSeries("Mar", barConfig);
        seriesData.setSeriesPoints(getPoints(seriesData, 12));
        chart.addSeries(seriesData);

        window.addComponent(chart);
kind regards