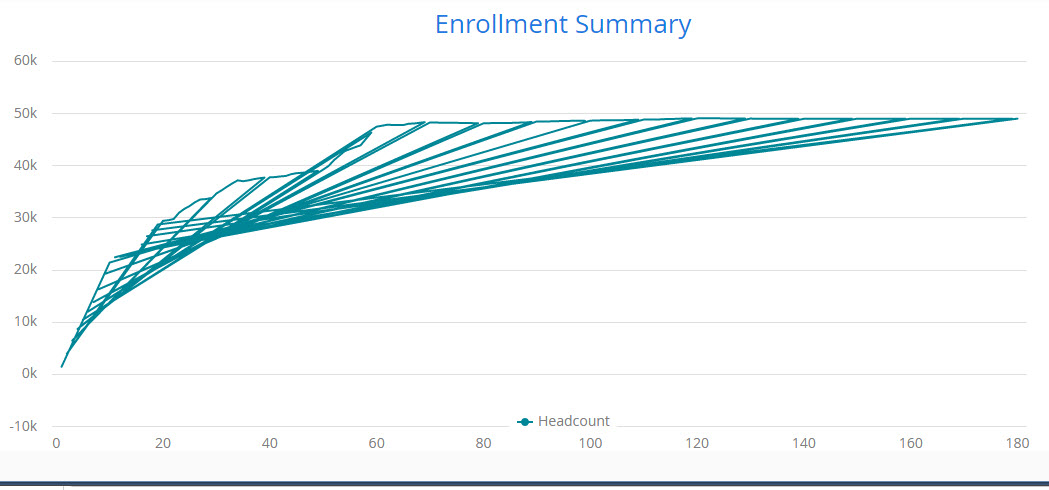
Very new to Vaadin and Vaadin charts. I have a simple line chart I am trying to create from a BeanItemContainer. The BeanItemContainer work perfectly when I put it into a grid, but after adding it to a series then a chart, I get way too many lines, when there should just be one line. (See attachment) Here is my code for the chart:
[code]
Chart enrollmentChart = new Chart();
enrollmentChart.setHeight(“450px”);
enrollmentChart.setWidth(“85%”);
Configuration configuration = enrollmentChart.getConfiguration();
configuration.getChart().setType(ChartType.LINE);
configuration.getChart().setMarginRight(130);
configuration.getChart().setMarginBottom(25);
configuration.getTitle().setText(“Enrollment Summary”);
ContainerDataSeries temp = new ContainerDataSeries(enrlContainer);
temp.setName(“Headcount”); temp.setXPropertyId(“regDay”);
temp.setYPropertyId(“headcount”);
PlotOptionsLine plotTemp = new PlotOptionsLine();
plotTemp.setColor(new SolidColor(“#008696”));
temp.setPlotOptions(plotTemp);
configuration.addSeries(temp);
enrollmentChart.drawChart(configuration);
[/code]I would be glad to provide any other information needed.
Thanks!