Hi All,
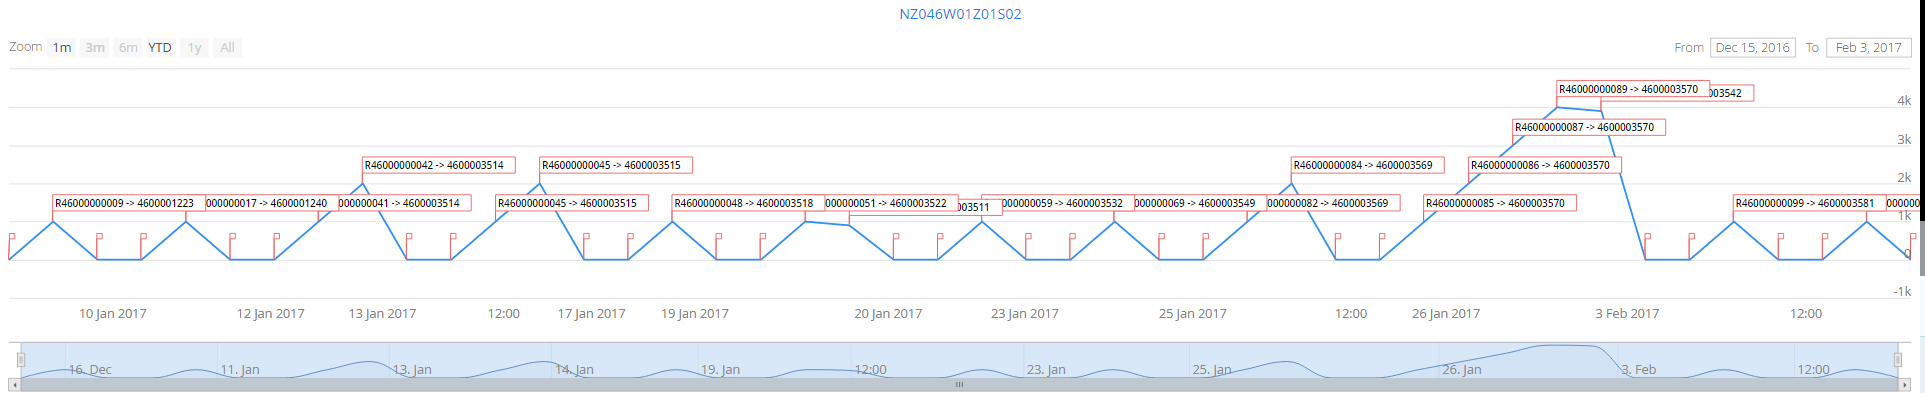
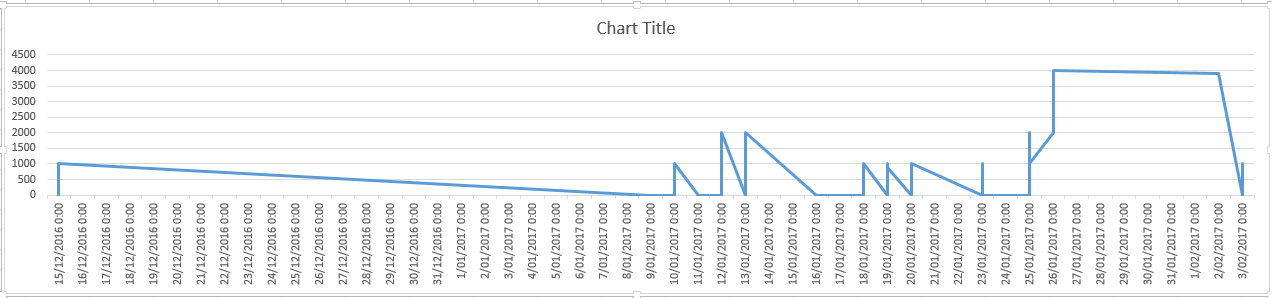
I have just made my first time line app. It uses type long for the Y axis and type java.util.date for the xaxis. Unfortunately it seems that it does not have a linear xaxis and simply spaces the data elements evenly. How do I force the chart to display the data in a linear date format. As a note I have used the legacy date for persistcce ease with spring boot.
package com.fonterra; import com.fonterra.backend.batch.Batch; import com.fonterra.backend.batch.BatchService; import com.fonterra.backend.batchhistory.BatchHistoryDataElement; import com.fonterra.backend.storageunit.StorageUnit; import com.fonterra.backend.storageunit.StorageUnitService; import com.vaadin.addon.charts.Chart; import com.vaadin.addon.charts.model.*; import com.vaadin.addon.charts.model.style.SolidColor; import com.vaadin.annotations.Theme; import com.vaadin.server.VaadinRequest; import com.vaadin.spring.annotation.SpringUI; import com.vaadin.ui.Label; import com.vaadin.ui.UI; import com.vaadin.ui.themes.ValoTheme; import org.springframework.beans.factory.annotation.Autowired; import java.util.*; @SpringUI @Theme(ValoTheme.THEME_NAME) public class BatchHistoryApplicationUI extends UI { @Autowired StorageUnitService storageUnitService; @Autowired BatchService batchService; @Override protected void init(VaadinRequest vaadinRequest) { final Chart chart = new Chart(); chart.setHeight("450px"); chart.setWidth("100%"); chart.setTimeline(true); Configuration configuration = chart.getConfiguration(); configuration.getTitle().setText("NZ046W01Z01S02"); XAxis xAxis = configuration.getxAxis(); DataSeries dataSeries = new DataSeries(); dataSeries.setId("NZ046W01Z01S02"); DataSeries flagsOnSeries = new DataSeries(); PlotOptionsFlags plotOptionsFlags = new PlotOptionsFlags(); plotOptionsFlags.setOnSeries("NZ046W01Z01S02"); flagsOnSeries.setPlotOptions(plotOptionsFlags); StorageUnit storageUnit = storageUnitService.retrieveStorageUnit("NZ046W01Z01S02"); List<Batch> batchList = batchService.retrieveBatchList(storageUnit.getKey()); for (Batch batch : batchList) { for (BatchHistoryDataElement data : batchService.retrieveBatchHistory(batch)) { DataSeriesItem item = new DataSeriesItem(); item.setX(data.getTransactionDate()); item.setY(data.getBatchVolume()); dataSeries.add(item); String comment = ""; if (data.getBatchTransaction() != null) { comment = data.getBatchTransaction().toString(); } flagsOnSeries.add(new FlagItem(item.getX(), comment, "Batch: " + batch.getName())); System.out.println(data.getTransactionDate() +", "+ data.getBatchVolume()); } } configuration.setSeries(dataSeries,flagsOnSeries); RangeSelector rangeSelector = new RangeSelector(); rangeSelector.setSelected(1); configuration.setRangeSelector(rangeSelector); chart.drawChart(configuration); setContent(chart); } }Any thoughts would be much appreceiated.
Regards
Johann