1 have a complex sql query which I use to populate the table, which returns 700+ records It is a requirement to show these records to the user at once as a long list
currently I am using the table’s default container implementation
with the help of the jdbc resultset metadata I add a property to the table for each column find in the ResultSet
and after that I iterate through the resultset and add items to the container
I also use some generated colums to show people s name instead of their ID-s
and I also use a CellStyleGenerator to color each row according to its content’s status
I use
table.setPageLength(0);
table.setHeight(null);
to show all the 700+ records
have multiple table-s , so I use multiple threads to populate the tables ( one thread for each table)
am using a progressindicator for each table
i am using the TPT-addon to make working with threads a bit easier
and I also added code for the threads to run in a predefined order
I have a total of 9 tables with 1000+ items sometimes
basically that is all in general
my problem is that there are a lot of random cases when the progress indicator for the 700+ table stays on the screen for ever and the table is never displayed
but in the log/debug output I can see that the method responsible for populating the table is finished withouth error, so there is no problem with the query or the database
So I think it should be a problem with vaadin
I suposse there is a problem with the generated columns or the cellstylegenerator I use , but I have no clue because there is no errors or exceptions in the error log
What can I do to solve this problem ?
How can I found what causes really this problem in vaadin?
And more importantly how can I really make it work?
is it a table misconfiguration issue, or an issue with th container I am using , or an issue with vaadin or all or some of the previous reasons?
Is there a better container for the job? (currently I am experimenting with sqlcontainer with no luck unfortunatelly)
Should I use some other solution (for example dontpush ozone layer addon ) to implement bidirectional communication and make UI updates more seamless , and to provide a better user experience?
is there a way to show the table’s header first with a spinning progress indicator inside it’s body until it is fully populated with data?
( in the tests currently am getting an empty screen with a spining progressindicator in the top corner until the table is not fully populated)
I am still having this problem and I dont know how to solve or debug it
I dont know where to start unfortunately
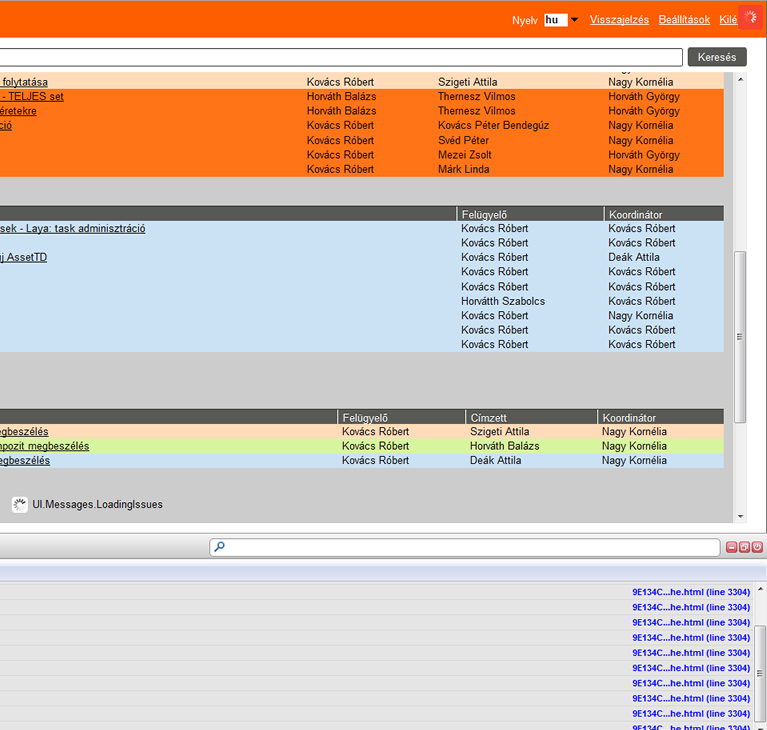
I attach a screenshot to demonstrate the problem
as you can see there is a loading indicator for the current table (with the query that results in+ 700 rows) at the bottom of the screen and there is also the famous “red wheel of death” which indicates that whatever happens it takes more than 5000 ms
I am using postgresql 9.1 database with postgresql-9.1-901.jdbc4.jar JDBC driver
I am using a static class to load the jdbc driver , and to obtain a connection to the database, so there is no datasource configuration in tomcat or web.xml
I am using tomcat 7.0.23 server
and I executed the query with pgadmin (a GUI client for postgresql ), and according to that the query took a 1600-2500 ms
So I think the problem is not the database, the problem is vaadin
But I dont know where/how to start debuging what takes so long , and how to solve the problem after that of course
700+ rows without lazy loading is a lot - the Table component is designed primarily for lazy loading and its layout mechanism certainly gets slower with a large number of displayed rows.
I suspect that the layout phase is the most expensive part here (browser using CPU rather than the server), especially as you have hundreds of components being shown at once in one layout (Table) - some from the generated columns, …
First turn on the debug console and see what it outputs about the duration of the server visit etc. To do that, just add “?debug” to your URL.
As always in such cases, start the investigation with trying to find out what are the real causes. Measure the time taken by the different phases in your unmodified application (server visit and rendering on the client). Then remove some features (e.g. the generated columns) and measure again. Remove some other features or reduce the amount of data and measure again. Continue until you identify what are the main causes of the slowness in your case. If this is too slow, start from the other end: take a very minimal starting point and then add features one by one. The same technique is also very good for finding bugs.
One thing that might help (to try after measuring the impact of removing your generated fields, if significant): replace the generated columns with formatting if all they do is format text fields that are already there. Another thing to try (if you haven’t already) would be to fix the initial widths of all columns in pixels, and not make the table follow the parent layout width.
A quick way to check if the JavaScript takes most of the time, is to use a different browser. Try to benchmark your app with Opera or Chrome and see if it’s faster. If that’s the case, your layout is probably too complex (as Henri already said) or you need to help Vaadin in terms of layout calculations.
I once had a similar effect and I found that the layout calculation could be speeded up dramatically by setting the height and width of an Embedded component inside a HorizontalLayout.
If I were you, I would remove step by step the Vaadin tables together with the corresponding db loading calls. This way, you can see if a special Vaadin table is causing the main delay.
On the other side: if the pure db loading is taking 2.5 seconds, and the whole time is 5 seconds, you can also spend some time on improving the db loading…