Invient Chart: Vertical DateTimePlotLine not working properly

I am using Invient charts in an application that is plotting double values (y-axis) as a function of time (x-axis). This works just fine. I also want to show vertical plot lines to mark times of particular interrest. This, however, only works if the time between sample values are large enough (typically one day).

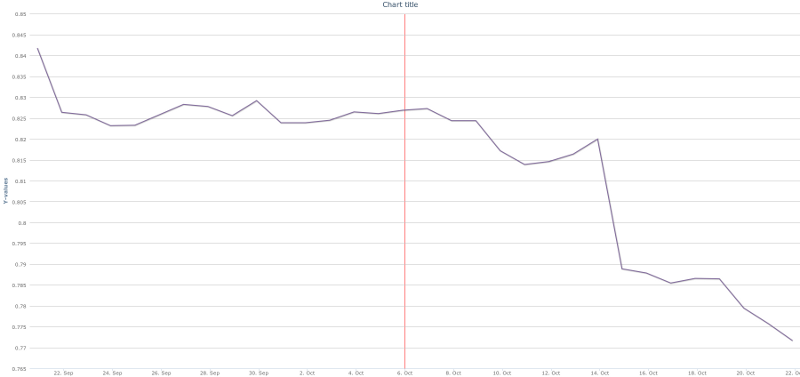
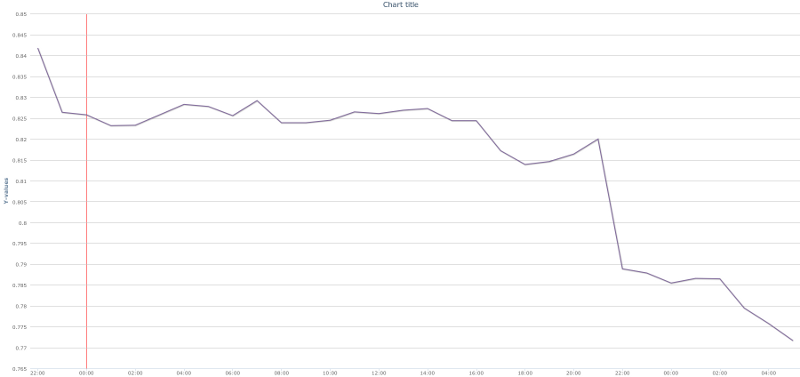
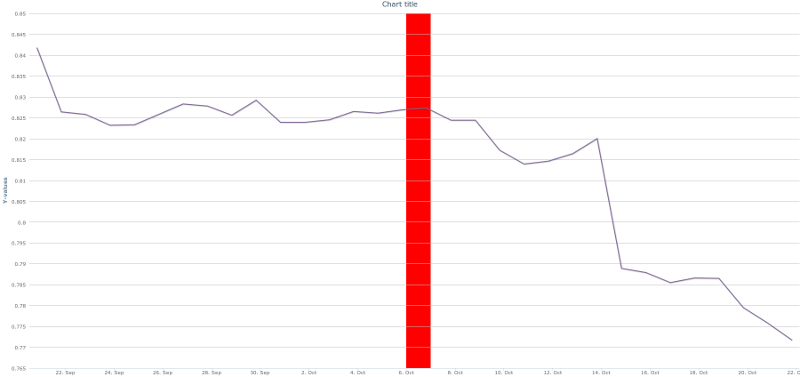
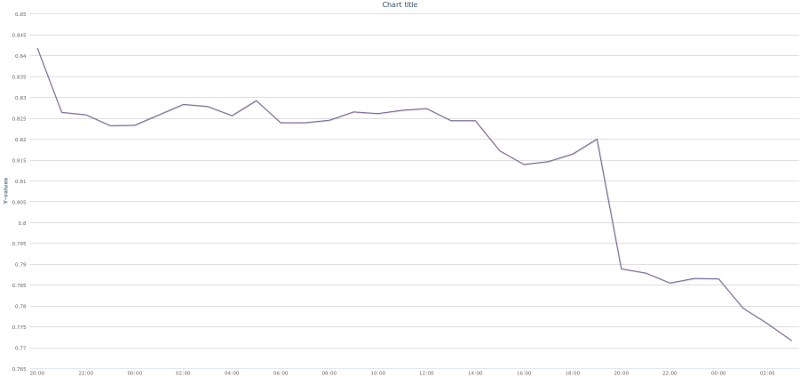
I have written a simle demo application to illustrate the problem. The posted code works just fine. However, if you replace the INTERVAL (DAY) value with the second line (HOUR), the plot line will show up to the left of the chart (at ‘00:00’) and not the expected “center position”. Presentation of the time series always seems OK. It is only the vertical plot line that seems to be wrongly positioned.

I have also attached a couple of screen shots showing how the vertical plot line is presented in the two cases.


import java.util.*;

import com.vaadin.ui.VerticalLayout;

import com.invient.vaadin.charts.Color.RGB;
import com.invient.vaadin.charts.InvientCharts;
import com.invient.vaadin.charts.InvientCharts.DateTimePoint;
import com.invient.vaadin.charts.InvientCharts.DateTimeSeries;
import com.invient.vaadin.charts.InvientCharts.SeriesType;
import com.invient.vaadin.charts.InvientChartsConfig;
import com.invient.vaadin.charts.InvientChartsConfig.AxisBase.DateTimePlotLine;
import com.invient.vaadin.charts.InvientChartsConfig.AxisBase.DateTimePlotLine.DateTimeValue;
import com.invient.vaadin.charts.InvientChartsConfig.DateTimeAxis;
import com.invient.vaadin.charts.InvientChartsConfig.NumberYAxis;
import com.invient.vaadin.charts.InvientChartsConfig.XAxis;
import com.invient.vaadin.charts.InvientChartsConfig.YAxis;

public class ChartDemo extends VerticalLayout {

    private static final long INTERVAL = 1000 * 60 * 60 * 24; // Interval=DAY work
    //private static final long INTERVAL = 1000 * 60 * 60;   // Interval=HOUR does NOT work
    private static final Date START_TIME = getDate(2011, 8, 20, 22, 0, 0);
    private static final double[] POINTS = {
            0.8418, 0.8264, 0.8258, 0.8232, 0.8233, 0.8258, 0.8283, 0.8278,
            0.8256, 0.8292, 0.8239, 0.8239, 0.8245, 0.8265, 0.8261, 0.8269,
            0.8273, 0.8244, 0.8244, 0.8172, 0.8139, 0.8146, 0.8164, 0.82,
            0.7889, 0.7879, 0.7855, 0.7866, 0.7865, 0.7795, 0.7758, 0.7717};

    public ChartDemo() {
        setSizeFull();

        // Create and x-axis
        DateTimeAxis xAxis = new DateTimeAxis();
        LinkedHashSet<XAxis> xAxes = new LinkedHashSet<InvientChartsConfig.XAxis>();
        xAxes.add(xAxis);

        // Create and add y-axis
        NumberYAxis yAxis = new NumberYAxis();
        LinkedHashSet<YAxis> yAxes = new LinkedHashSet<InvientChartsConfig.YAxis>();
        yAxes.add(yAxis);

        // Chart configuration
        InvientChartsConfig chartConfig = new InvientChartsConfig();
        chartConfig.getGeneralChartConfig().setReflow(false);
        chartConfig.getLegend().setEnabled(false);
        chartConfig.getCredit().setEnabled(false);
        chartConfig.setXAxes(xAxes);
        chartConfig.setYAxes(yAxes);

        // Create and configure line marker
        InvientChartsConfig.SymbolMarker marker = new InvientChartsConfig.SymbolMarker(false);
        marker.setHoverState(new InvientChartsConfig.MarkerState());
        marker.getHoverState().setEnabled(true);
        marker.getHoverState().setRadius(3);

        // Series configuration
        InvientChartsConfig.LineConfig lineConfig = new InvientChartsConfig.LineConfig();
        lineConfig.setMarker(marker);
        lineConfig.setLineWidth(2);
        lineConfig.setColor(new RGB(128, 105, 155));

        // Create and add the chart
        InvientCharts chart = new InvientCharts(chartConfig);
        chart.setSizeFull();
        addComponent(chart);

        // Create the series
        DateTimeSeries dateTimeSeries = new DateTimeSeries("Series", SeriesType.LINE, lineConfig, true);
        dateTimeSeries.setSeriesPoints(new LinkedHashSet<DateTimePoint>());

        // Add points to series
        int counter = 0;
        for (double value : POINTS) {
            dateTimeSeries.addPoint(new DateTimePoint(dateTimeSeries, new Date(START_TIME.getTime() + INTERVAL * counter++), value));
        }

        // Add series to chart
        chart.addSeries(dateTimeSeries);

        // Show plot line (x-axis)
        DateTimePlotLine dateTimePlotLine = new DateTimePlotLine("PlotLine");
        dateTimePlotLine.setValue(new DateTimeValue(new Date(START_TIME.getTime() + 16 * INTERVAL)));
        dateTimePlotLine.setColor(new RGB(255, 0, 0));
        xAxis.addPlotLine(dateTimePlotLine);
    }

    private static Date getDate(int year, int month, int day, int hour, int minute, int second) {
        Calendar cal = GregorianCalendar.getInstance();
        cal.set(Calendar.YEAR, year);
        cal.set(Calendar.MONTH, month);
        cal.set(Calendar.DAY_OF_MONTH, day);
        cal.set(Calendar.HOUR_OF_DAY, hour);
        cal.set(Calendar.MINUTE, minute);
        cal.set(Calendar.SECOND, second);
        cal.set(Calendar.MILLISECOND, 0);
        cal.setTimeZone(TimeZone.getTimeZone("GMT"));
        return cal.getTime();
    }
}

12369.png
12370.png

I just modified my sample code to show a ‘plot bands’ instead of a ‘plot line’ and there seem to be a similar issue (bug) in the plot band implementation. When using the “DAY INTERVAL”, the vertical one day band is drawn in the center as exepected. However, when using the “HOUR INTERVAL”, the vertical band is not shown at all.

I have attached the modified code and screen shots for the plot band implementation.

While working on the ‘plot line’ demo code, I noticed that I had to use the DateTimeSeries constructor with the ‘isIncludeTime’ parameter to avoid sample points to be discarded while calling dateTimeSeries.addPoint(). Maybe Invient chart is ignoring the “time-part” of the java.util.Date provided for plot lines and plot bands?


package no.cronus.forit.demo;

import java.util.*;

import com.vaadin.ui.VerticalLayout;

import com.invient.vaadin.charts.Color.RGB;
import com.invient.vaadin.charts.InvientCharts;
import com.invient.vaadin.charts.InvientCharts.DateTimePoint;
import com.invient.vaadin.charts.InvientCharts.DateTimeSeries;
import com.invient.vaadin.charts.InvientCharts.SeriesType;
import com.invient.vaadin.charts.InvientChartsConfig;
import com.invient.vaadin.charts.InvientChartsConfig.AxisBase.DateTimePlotBand;
import com.invient.vaadin.charts.InvientChartsConfig.AxisBase.DateTimePlotBand.DateTimeRange;
import com.invient.vaadin.charts.InvientChartsConfig.DateTimeAxis;
import com.invient.vaadin.charts.InvientChartsConfig.NumberYAxis;
import com.invient.vaadin.charts.InvientChartsConfig.XAxis;
import com.invient.vaadin.charts.InvientChartsConfig.YAxis;

public class ChartDemo extends VerticalLayout {

    private static final long INTERVAL = 1000 * 60 * 60 * 24; // Interval=DAY work
    //private static final long INTERVAL = 1000 * 60 * 60;   // Interval=HOUR does NOT work
    private static final Date START_TIME = getDate(2011, 8, 20, 22, 0, 0);
    private static final double[] POINTS = {
            0.8418, 0.8264, 0.8258, 0.8232, 0.8233, 0.8258, 0.8283, 0.8278,
            0.8256, 0.8292, 0.8239, 0.8239, 0.8245, 0.8265, 0.8261, 0.8269,
            0.8273, 0.8244, 0.8244, 0.8172, 0.8139, 0.8146, 0.8164, 0.82,
            0.7889, 0.7879, 0.7855, 0.7866, 0.7865, 0.7795, 0.7758, 0.7717};

    public ChartDemo() {
        setSizeFull();

        // Create and x-axis
        DateTimeAxis xAxis = new DateTimeAxis();
        LinkedHashSet<XAxis> xAxes = new LinkedHashSet<InvientChartsConfig.XAxis>();
        xAxes.add(xAxis);

        // Create and add y-axis
        NumberYAxis yAxis = new NumberYAxis();
        LinkedHashSet<YAxis> yAxes = new LinkedHashSet<InvientChartsConfig.YAxis>();
        yAxes.add(yAxis);

        // Chart configuration
        InvientChartsConfig chartConfig = new InvientChartsConfig();
        chartConfig.getGeneralChartConfig().setReflow(false);
        chartConfig.getLegend().setEnabled(false);
        chartConfig.getCredit().setEnabled(false);
        chartConfig.setXAxes(xAxes);
        chartConfig.setYAxes(yAxes);

        // Create and configure line marker
        InvientChartsConfig.SymbolMarker marker = new InvientChartsConfig.SymbolMarker(false);
        marker.setHoverState(new InvientChartsConfig.MarkerState());
        marker.getHoverState().setEnabled(true);
        marker.getHoverState().setRadius(3);

        // Series configuration
        InvientChartsConfig.LineConfig lineConfig = new InvientChartsConfig.LineConfig();
        lineConfig.setMarker(marker);
        lineConfig.setLineWidth(2);
        lineConfig.setColor(new RGB(128, 105, 155));

        // Create and add the chart
        InvientCharts chart = new InvientCharts(chartConfig);
        chart.setSizeFull();
        addComponent(chart);

        // Create the series
        DateTimeSeries dateTimeSeries = new DateTimeSeries("Series", SeriesType.LINE, lineConfig, true);
        dateTimeSeries.setSeriesPoints(new LinkedHashSet<DateTimePoint>());

        // Add points to series
        int counter = 0;
        for (double value : POINTS) {
            dateTimeSeries.addPoint(new DateTimePoint(dateTimeSeries, new Date(START_TIME.getTime() + INTERVAL * counter++), value));
        }

        // Add series to chart
        chart.addSeries(dateTimeSeries);

        // Show plot band (x-axis)
        DateTimePlotBand dateTimePlotBand = new DateTimePlotBand("PlotBand");
        dateTimePlotBand.setRange(new DateTimeRange(new Date(START_TIME.getTime() + 16 * INTERVAL), new Date(START_TIME.getTime() + 17 * INTERVAL)));
        dateTimePlotBand.setColor(new RGB(255, 0, 0));
        xAxis.addPlotBand(dateTimePlotBand);
    }

    private static Date getDate(int year, int month, int day, int hour, int minute, int second) {
        Calendar cal = GregorianCalendar.getInstance();
        cal.set(Calendar.YEAR, year);
        cal.set(Calendar.MONTH, month);
        cal.set(Calendar.DAY_OF_MONTH, day);
        cal.set(Calendar.HOUR_OF_DAY, hour);
        cal.set(Calendar.MINUTE, minute);
        cal.set(Calendar.SECOND, second);
        cal.set(Calendar.MILLISECOND, 0);
        return cal.getTime();
    }
}

12373.png
12374.png