Hello,everybody.
I want repeat this
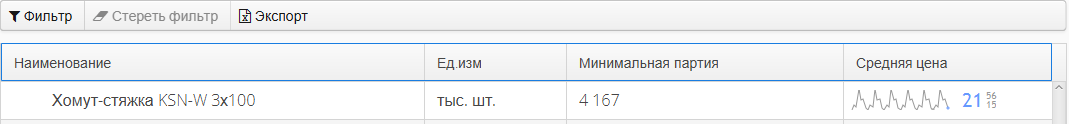
example with stock chart in Grid Column
, but can’t find a sourcecode of this one.
Can you help me?
Hello,everybody.
I want repeat this
example with stock chart in Grid Column
, but can’t find a sourcecode of this one.
Can you help me?
You can find the SparklineRenderer here:
https://vaadin.com/directory#!addon/grid-renderers-collection-for-vaadin7
Thanks, i find it too…
I met a difficulty with SparklineRenderer. This class extends Number type. In Demo about SparklineRenderer, fields in Grid created manually with same type. But when i try using SparklineRenderer with DB table i get error that Column’s model type not compatible with Number
type. I use postgresql and used different types for this column : Double precision , Numeric
, String(like array of numeric).
Can you tell me about compatibility Number type and any DB type, or about converting between this types?
You can convert values in any grid column by setting a converter:
Grid.getColumn().setConverter()
Which converter need in this case?
You’ll need to make your own. Don’t worry, it’s a simple interface ![]() You don’t even need to implement the convertToModel method, since you’ll only display data.
You don’t even need to implement the convertToModel method, since you’ll only display data.
Thanks, but i solved my problem with next approach : i use Sparklines class(it’s component) and Table. And i have need to me result.
My example