Miguel_Angel1
(Miguel Angel Salinas Gancedo)
1
How can I scale the Y axis Vaadin Charts when the variability is less than 1?. For example:
[x, y]
= [[1, 0.004]
, [2, 0.003]
, [3, 0.008]
, … ]
I noticed than the Y axis is autoscale but don’ for values under 1.
I’m using Vaadin Charts 1.1.2
Regards
Hi Miguel Angel,
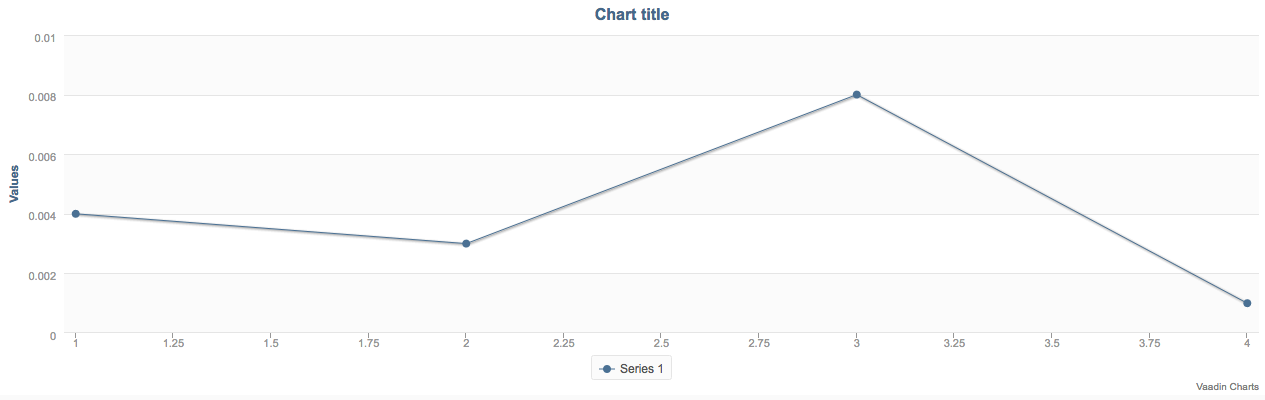
I did a small test
[code]
private Chart getChartWithSmallValues() {
Chart chart = new Chart();
Configuration configuration = chart.getConfiguration();
DataSeries series = new DataSeries();
series.add(new DataSeriesItem(1, 0.004));
series.add(new DataSeriesItem(2, 0.003));
series.add(new DataSeriesItem(3, 0.008));
series.add(new DataSeriesItem(4, 0.001));

configuration.addSeries(series);

return chart;
}
[/code]And it seems to work as expected, look at the attachment. I’m using Vaadin Charts 1.1.2 and Vaadin 7.6.6.
Are you doing any special config for the YAxis? Try checking what configuration is affecting the scaling.
If you still have issues please attach a code snippet that can be used to verify the issue.
Regards,
Guille