Important Notice - Forums is archived
To simplify things and help our users to be more productive, we have archived the current forum and focus our efforts on helping developers on Stack Overflow. You can post new questions on Stack Overflow or join our Discord channel.

Vaadin lets you build secure, UX-first PWAs entirely in Java.
Free ebook & tutorial.
Charts Not Showing Edge Data (left, right, both)
Hi,
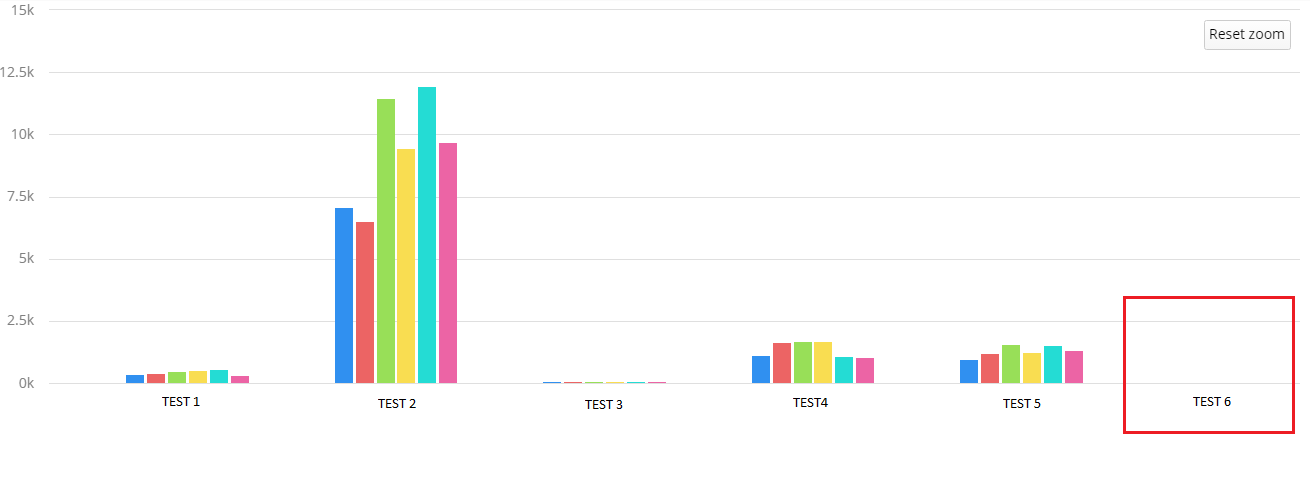
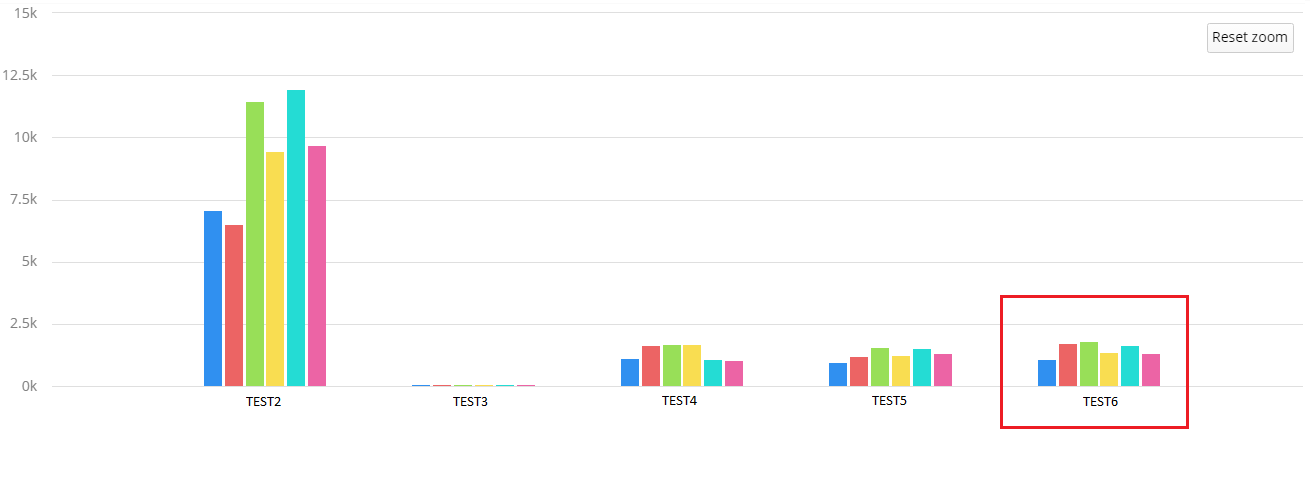
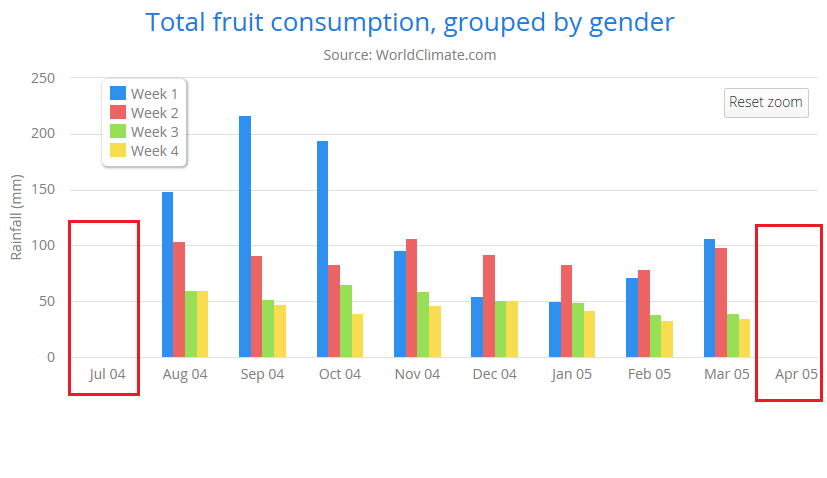
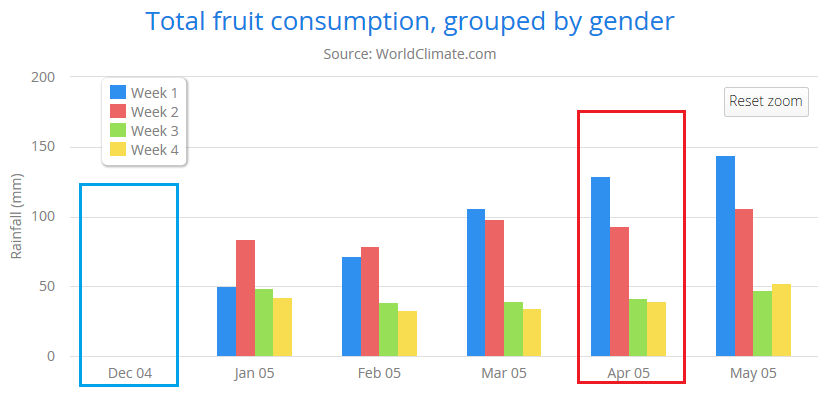
I encountered something I find difficult to resolve in vaadin charts. I am using Bar charts where XAxis is enabled with Zoom gesture. However, as I zoomed in, there are times when the left data or right data or sometimes both, doesn't show their data. Please see the attached screenshot for your better understanding of my situation.
Thank you in advance!
Best regards,
Adrian
Hi Adrian,
I can understand your problem but haven't been able to reproduce it.
Could you provide a simple code example that reproduces it? A method that returns a Chart that reproduces the issue when being zoomed would be enough.
Regards,
Guille
Hi Guillermo,
I noticed that this problem happens only when you have a huge data. Please see the screenshots as well as the java class example of chart.
Thank you in advance!
Best regards,
Adrian
Hi Guille,
Did you manage to simulate the problem using the attached source code?
Best regards,
Adrian
Hi Adrian,
I haven't been able to reproduce it yet, I'll try to make some time today to test your files.
Regards,
Guille
Hi Adrian,
Now I've been able to reproduce the issue. Unluckily it seems to be an open issue in the underlying chart library that Vaadin Charts uses.
As a workaround I've noticed that setting CropThreshold value to the size of the data series or the amount of categories seems to work. Look at the following code snippet:
PlotOptionsColumn options = new PlotOptionsColumn();
options.setCropThreshold(120);
conf.setPlotOptions(options);
The problem with this is that it might cause performance issues if value is too high.
Hi Guille,
Thank you for the follow up. I tried the setCropThreshold() it seemed to be working. It is available in Vaadin charts 3.0.0 and will try to update my project with the latest stable Vaadin release.
Thank you for the help.
Best regards,
Adrian
Glad it worked!
Remember to check the Charts 2 to Charts 3 Migration Guide while doing the upgrade.
Guillermo Alvarez: Glad it worked!
Remember to check the Charts 2 to Charts 3 Migration Guide while doing the upgrade.
Noted, Guille.
Best regards,
Adrian