Charts: RangeSelector causes no data to be displayed

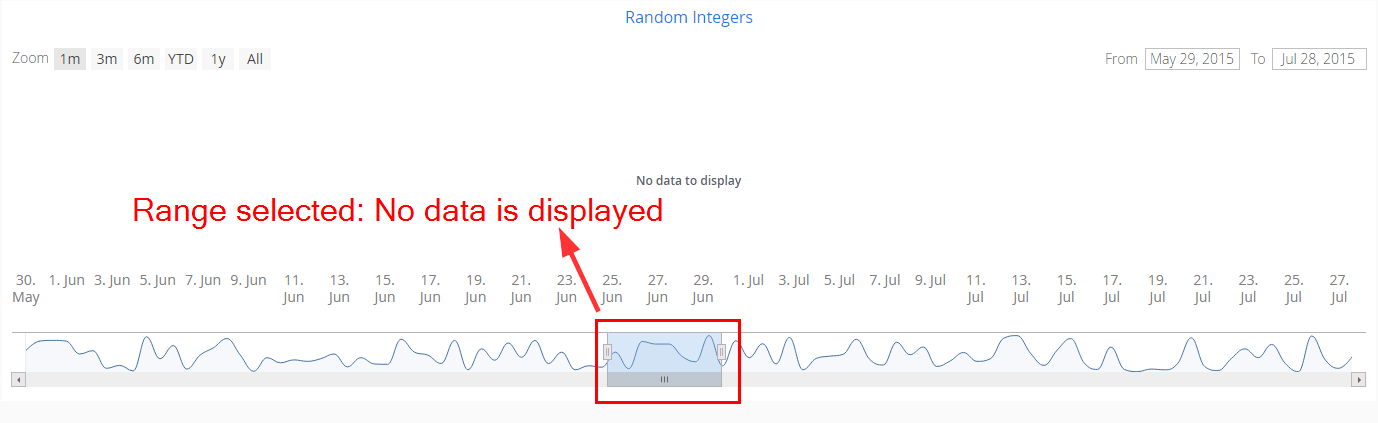
Using the new RangeSelector causes our charts to not show any values, even though there are in fact values present:


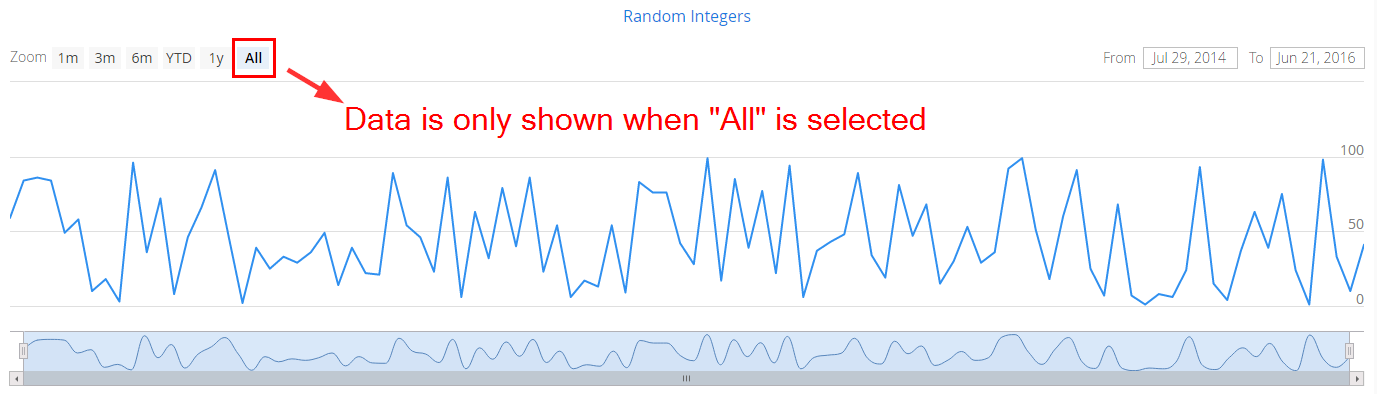
When I select all data then data is shown:

Why is the RangeSelector not working? Is there something we are not doing that we should do?

Here is the code that I copied from the Vaadin examples, it uses random integers between 1 and 100 as data points:

public class ChartExample extends CustomComponent {
    public ChartExample() {
        BorderLayoutCenterBottom borderLayout = new BorderLayoutCenterBottom();

        Component chart = createExampleChart();
        borderLayout.center.addComponent(chart);
        borderLayout.center.setExpandRatio(chart, 1.0f);
        setCompositionRoot(borderLayout);
    }

    public Component createExampleChart() {
        final Chart chart = new Chart();
        chart.setSizeFull();
        chart.setTimeline(true);

        Configuration configuration = chart.getConfiguration();
        configuration.getTitle().setText("Random Integers");

        DataSeries dataSeries = new DataSeries();
        for (int i = 0; i < 100; i++) {
            DataSeriesItem item = new DataSeriesItem();
            item.setX(Date.from(LocalDateTime.ofInstant(new Date().toInstant(), ZoneId.systemDefault()).minusDays(i*7).atZone(ZoneId.systemDefault()).toInstant()));
            item.setY(ThreadLocalRandom.current().nextInt(1, 100));
            dataSeries.add(item);
        }
        configuration.setSeries(dataSeries);

        RangeSelector rangeSelector = new RangeSelector();
        rangeSelector.setSelected(5);
        configuration.setRangeSelector(rangeSelector);

        chart.drawChart(configuration);

        return chart;
    }
}

26312.png
26313.png

Hi Johannes,

That’s a strange behavior I haven’t seen happening before.

Although I think I know the issue, can you check if you see any error in the browser console? I see in your example you’re using LocalDateTime#minusDays making data sorted descending by X value. In order to make timeline mode work with the navigator and range selector you need to have data sorted ascending by X value.

Hope this helps,

Guille

Yes, thank you that was the problem. When not sorting x in an ascending way I got this error in the JS console:

VM161:8 Highcharts error #15: www.highcharts.com/errors/15

When I sorted the X values, everything worked fine:

for (int i = 0; i < 100; i++) {
    DataSeriesItem item = new DataSeriesItem();
    item.setX(Date.from(LocalDateTime.ofInstant(new Date().toInstant(), ZoneId.systemDefault())[b]
.minusYears(2).plusDays(i)
[/b].atZone(ZoneId.systemDefault()).toInstant()));
    item.setY(ThreadLocalRandom.current().nextInt(1, 100));
    dataSeries.add(item);
}


Shouldn’t this be something that the Chart Component should take care of? Or at least print a warning on the logger?

26315.png

The component doesn’t validate the data, except for minimal item validation when serializing it. Amount of data might be really big, and it usually get’s worse when timeline is used.
I’ll check if some documentation or warning is missing.

Thanks for feedback!