Hi,
this is pretty much the same as the
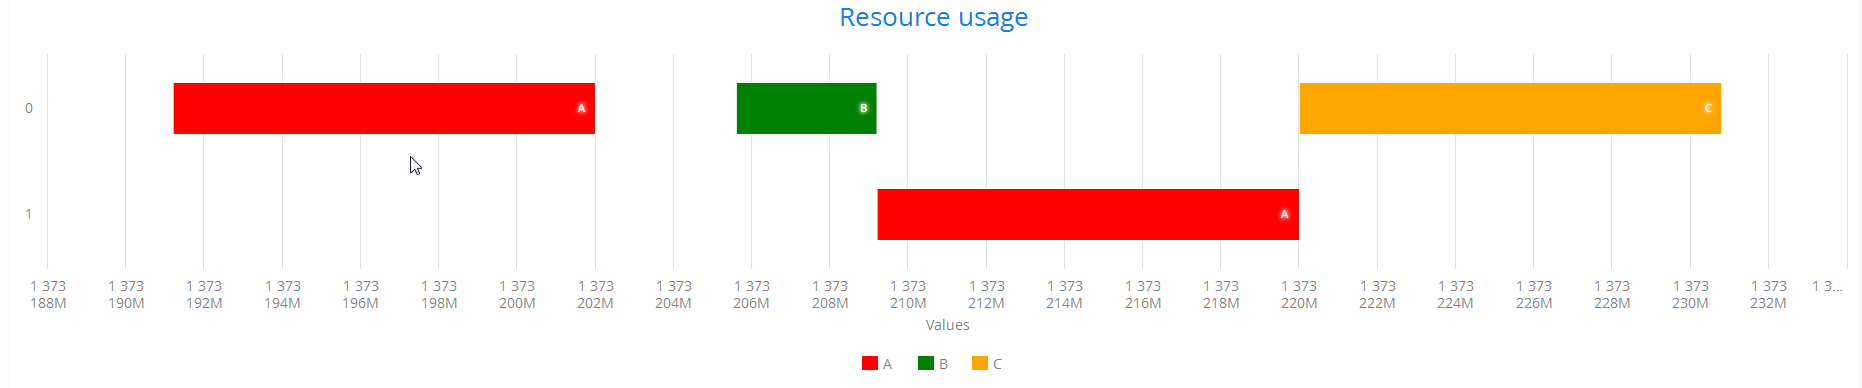
ColumnRangeResourceUsage Demo
I use a chart of ChartType.COLUMNRANGE with 3 DataSeries (A, B, C - should reflect the status of a machine in a period of time). These items should be in a single row. So far as soon as I add a second DataSeriesItem to a DataSeries there’s a new row (see attached image).
Has anyone an idea how to do this? I know it would be possible to use multiple DataSeries with only 1 DataSeriesItem but I don’t like this as the legend would not work…
Thanks,
Klaus
        Chart chart = new Chart(ChartType.COLUMNRANGE);


        Configuration conf = chart.getConfiguration();
        conf.setTitle("Resource usage");
        conf.getChart().setInverted(true);

        PlotOptionsColumnrange columnRange = new PlotOptionsColumnrange();
        columnRange.setGrouping(false);
        DataLabelsRange dataLabels = new DataLabelsRange(true);
        dataLabels
                .setFormatter("this.y == this.point.low ? '' : this.series.name");
        dataLabels.setInside(true);
        dataLabels.setColor(new SolidColor("white"));
        columnRange.setDataLabels(dataLabels);
        columnRange.setGrouping(false);

        conf.setPlotOptions(columnRange);

        Calendar instance = Calendar.getInstance();
        instance.set(Calendar.MILLISECOND, 0);
        instance.set(2013, 6, 7, 12, 00, 00);

        DataSeries a = new DataSeries();
        a.setName("A");
        PlotOptionsColumnrange o = new PlotOptionsColumnrange();
        o.setColor(SolidColor.RED);
        a.setPlotOptions(o);
        o.setGrouping(true);

        DataSeries b = new DataSeries();
        o = new PlotOptionsColumnrange();
        o.setColor(SolidColor.GREEN);
        b.setPlotOptions(o);
        b.setName("B");

        DataSeries c = new DataSeries();
        o = new PlotOptionsColumnrange();
        o.setColor(SolidColor.ORANGE);
        c.setPlotOptions(o);
        c.setName("C");

        DataSeriesItem item;

        item = new DataSeriesItem();
        item.setName("Printer");
        item.setLow(instance.getTimeInMillis());
        instance.roll(Calendar.HOUR_OF_DAY, 3);
        item.setHigh(instance.getTimeInMillis());
        a.add(item);

        item = new DataSeriesItem();
        item.setName("Printer");
        instance.roll(Calendar.HOUR_OF_DAY, 1);
        item.setLow(instance.getTimeInMillis());
        instance.roll(Calendar.HOUR_OF_DAY, 1);
        item.setHigh(instance.getTimeInMillis());
        b.add(item);

        item = new DataSeriesItem();
        item.setName("Printer");
        item.setLow(instance.getTimeInMillis());
        instance.roll(Calendar.HOUR_OF_DAY, 3);
        item.setHigh(instance.getTimeInMillis());
        a.add(item);

        item = new DataSeriesItem();
        item.setName("Printer");
        item.setLow(instance.getTimeInMillis());
        instance.roll(Calendar.HOUR_OF_DAY, 3);
        item.setHigh(instance.getTimeInMillis());
        c.add(item);

        conf.setSeries(a, b, c);

        layout.addComponent(chart);