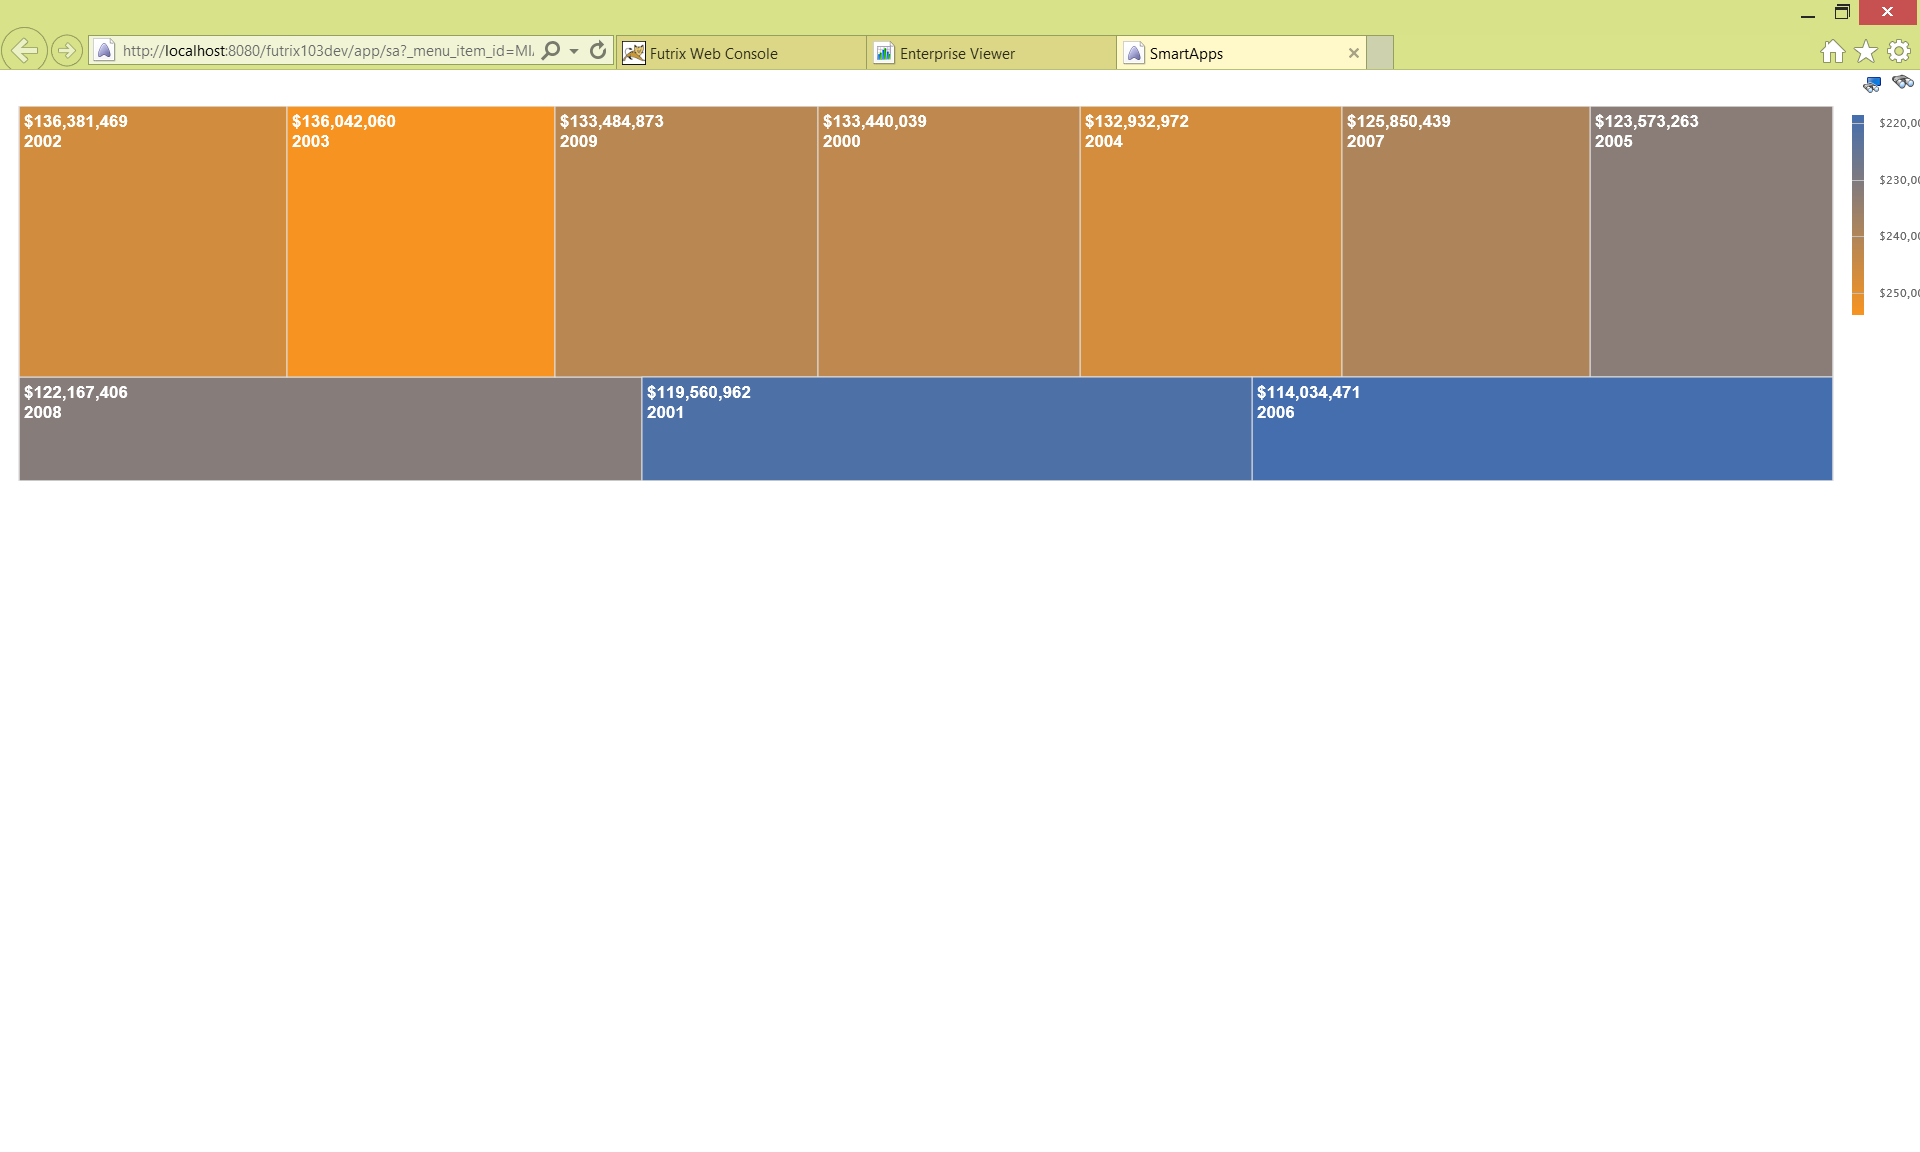
When using tree maps and heat maps wih a color axis, if the displayed values are large the chart display does not allow enough space for the text labels to display on screen.
Is this a known bug? Does anyone have a workaround?
When using tree maps and heat maps wih a color axis, if the displayed values are large the chart display does not allow enough space for the text labels to display on screen.
Is this a known bug? Does anyone have a workaround?