Important Notice - Forums is archived
To simplify things and help our users to be more productive, we have archived the current forum and focus our efforts on helping developers on Stack Overflow. You can post new questions on Stack Overflow or join our Discord channel.

Vaadin lets you build secure, UX-first PWAs entirely in Java.
Free ebook & tutorial.
Chart with multiple Y Axis
I have added three Y Axis( Y1,Y2,Y3), no one is linked with other.
Y1 contains positive values.
Y2 contains negative values.
Y3 contains positive values.
I want to show the chart with one grid for all three Y axis (only one gridline for value 0 for three Y axis so they start from this line.)
I have attached two images
current image - (Wrong)
want image- (Actually needed).
Have you tried to set same min and max values for all YAxis you use in the chart?
Hi Tatu,
Thanks for reply.
By using min and max value it works. but in my data difference betwwen Y1 and Y2 axis is big
ex: y1 ={10000,15000,36400,80000,.... } and
y2= { -10,-5,-3,-8,-15.....}
y3={ 100,210,165,378,....}
I have set min=10000 and max=80000.
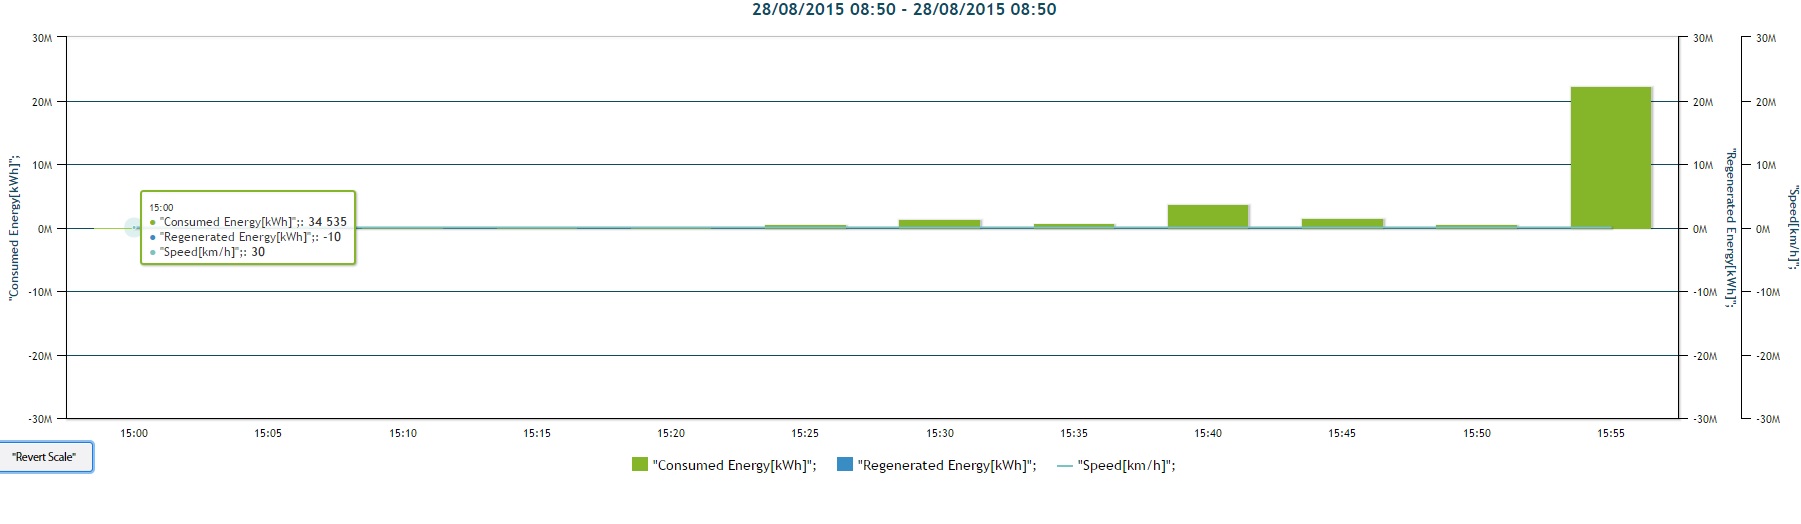
but Y2 and Y3 looks nothhing in graph see image "same_min_max_used" bellow
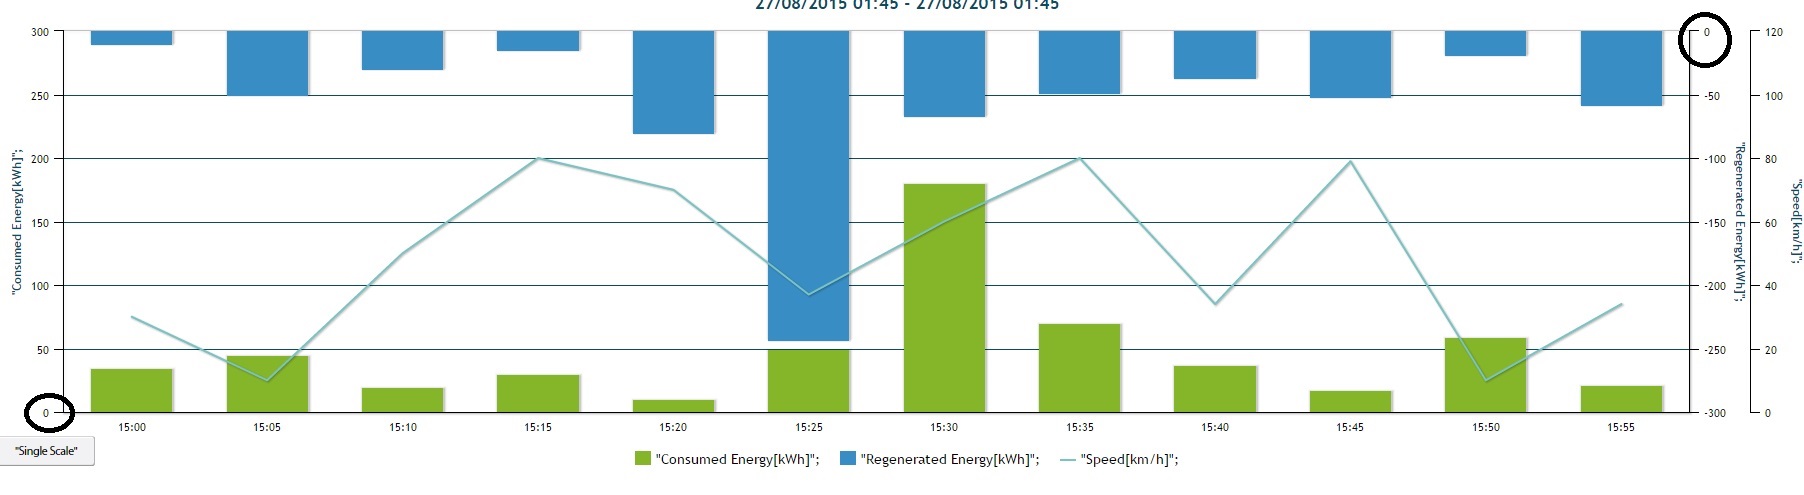
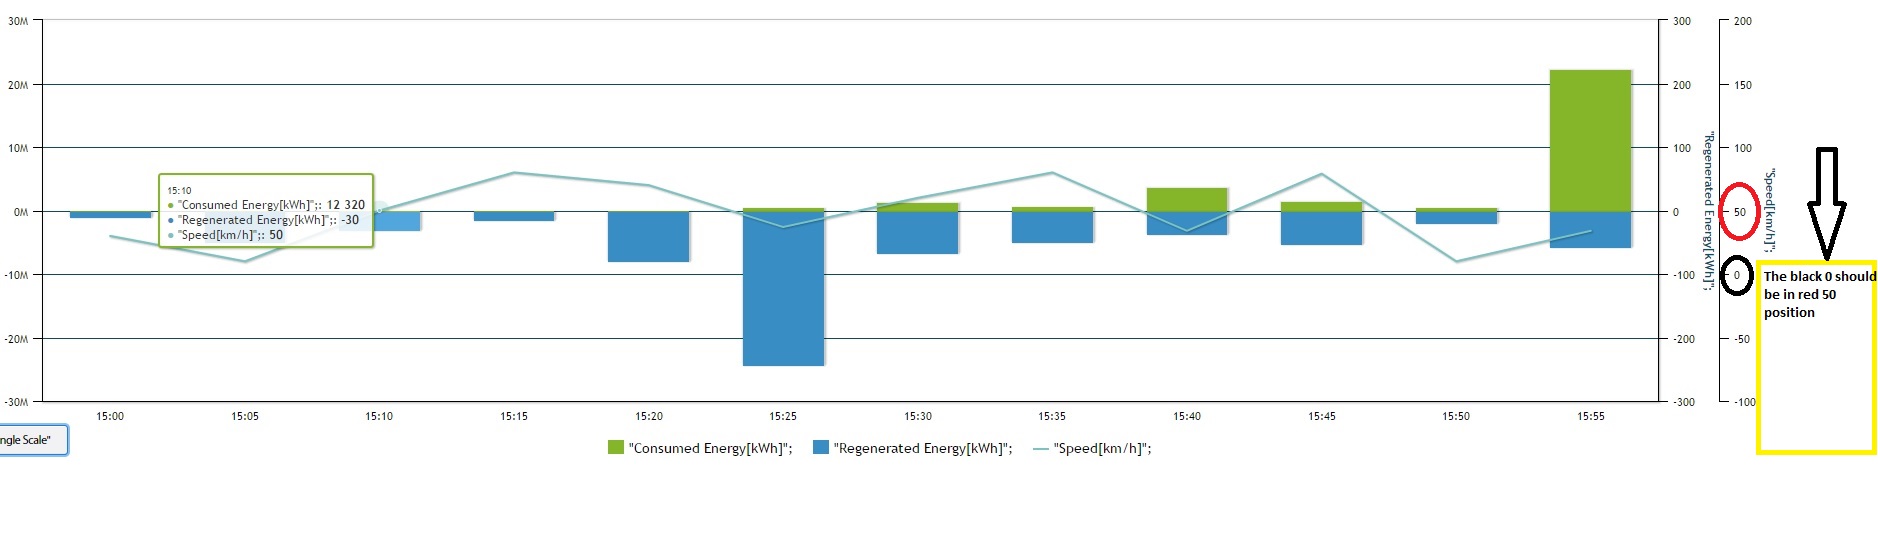
so I need the graph which contains different type of value but start from same one 0 gridline (so positive value display at up and negative will display at bottom.) see in :required" image bellow