svg-vizualizations - Vaadin Add-on Directory
Lightweight, high-performance SVG visualization components for Vaadin 25+.
Lightweight, high-performance SVG visualization components for Vaadin 25+. Only supports simple sparkline and
windrose, but your server shouldn't blink an eye if you feed it a million records at ones (built-in data simplification/smoothing algorightms).
This project serves as a testing ground for the new SVG namespace support in Vaadin 25 and the SVG-specific elements in [Viritin 3.1](https://github.com/viritin/viritin). The components are actively used in a real-world weather monitoring application, handling datasets with nearly 1 million data points.
## Components
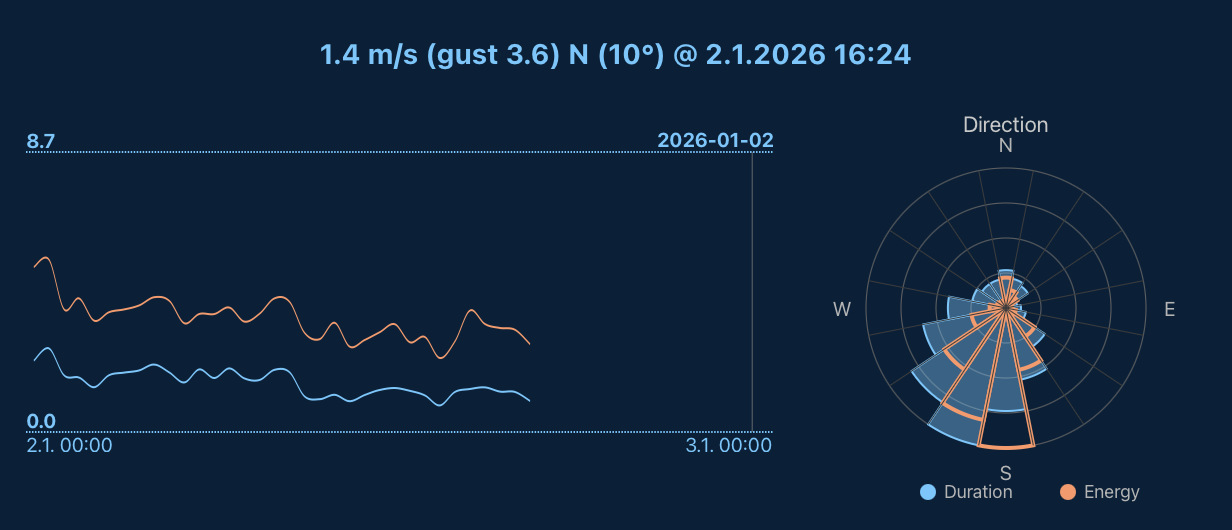
### SvgSparkLine
A lightweight SVG-based sparkline/line chart component optimized for large datasets.
**Features:**
- Multiple data series with custom colors
- Smoothing algorithms: None, Moving Average, RDP (Ramer-Douglas-Peucker)
- Interactive crosshair with position callbacks
- Timestamp/Instant-based data support
- Bezier curves or polyline rendering
- Fluid width (100%) or fixed dimensions
- Fixed or auto-fit x-axis range
- Min/max labels and time scale annotations
```java
SvgSparkLine sparkLine = new SvgSparkLine(500, 100);
sparkLine.setData(dataPoints); // List with timestamps
sparkLine.setSmoothing(SvgSparkLine.Smoothing.RDP);
sparkLine.setLineColor(NamedColor.BLUE);
sparkLine.addSeries(secondaryData, NamedColor.RED);
sparkLine.setCrosshairListener(relPos -> {
// Handle crosshair position (0.0 - 1.0)
});
```
### WindRose
A wind rose visualization for directional data distribution.
**Features:**
- Multiple data series (filled + outline styles)
- Configurable sector count (default: 16)
- Interactive clickable sectors with data callbacks
- Automatic legend generation
- Cardinal direction labels
- Reference circle grid
```java
WindRose windRose = new WindRose(300, 16);
windRose.addSeries("Duration", NamedColor.BLUE, durationBySector);
windRose.addSeries("Energy", NamedColor.RED, energyBySector);
windRose.setSectorClickListener(data -> {
// Handle sector click with direction, values, percentages
});
windRose.draw();
```
## Performance Characteristics
These components are designed for high performance with large datasets. Benchmarks use real weather station data (~948,000 records at 1-minute resolution over 2 years).
### Rendering Performance
| Data Points | No Smoothing | Moving Average | RDP |
|-------------|--------------|----------------|-----|
| 10,000 | ~4 ms | ~1 ms | ~3 ms |
| 100,000 | ~16 ms | ~2 ms | ~2 ms |
| 948,000 | ~154 ms | ~21 ms | ~17 ms |
With smoothing enabled, render times remain under 25ms even for nearly 1 million points.
### Memory Efficiency
| Stage | Memory |
|-------|--------|
| Raw data (948k records) | ~20 MB |
| After smoothing | ~1.2 KB |
| After draw() | **~58 bytes** |
**Key optimization:** Data is cleared after rendering since SVG elements retain the visualization. This achieves essentially **zero session memory overhead** regardless of input size. Same principle as in Vaadin Charts hack [LightChart](https://vaadin.com/directory/component/lightchart).
### Smoothing Algorithms
- **Moving Average**: Buckets data into ~50 points, averaging values per bucket. Best for noisy data.
- **RDP (Ramer-Douglas-Peucker)**: Preserves shape-significant points, removing redundant ones. Best for preserving peaks/valleys.
- **None**: Renders all points (use only for small or pre-optimised datasets, or a lot of resources spent on SVG generation, bandwidth and browser rendering).
## Requirements
- Vaadin 25+
- Viritin 3.1+ (transitive dependency, provides SVG Element API with better typing and performance optimisations)
## Development
Run the `TestServer` class from your IDE to start the development server.
Run performance tests:
```bash
mvn test -Dtest=RenderingPerformanceTest
mvn test -Dtest=SessionWeightTest
```
**Note:** Test data (~240 MB) is downloaded automatically on first test run from a remote server.
## License
Apache License 2.0
View on GitHubOnline Demo