Sooner or later, every software project has to consider performance to meet the customer’s expectations and to stay marketable. Therefore, a good monitoring tool is inevitable. Commercial solutions are expensive and existing open source projects are often not well suited for web applications or can’t monitor clustered applications.
Stagemonitor is an open source java application performance monitoring solution which gives you all the tools you need in development, quality assurance and production to monitor the performance of your Java web app. Stagemonitor was built with clustered application stacks in mind and it is possible to view historical as well as live data from your cluster or your developer server.
Development-time monitoring
In many cases you only learn about performance problems when it is way too late: when you get calls from an angry customer that your site is too slow.
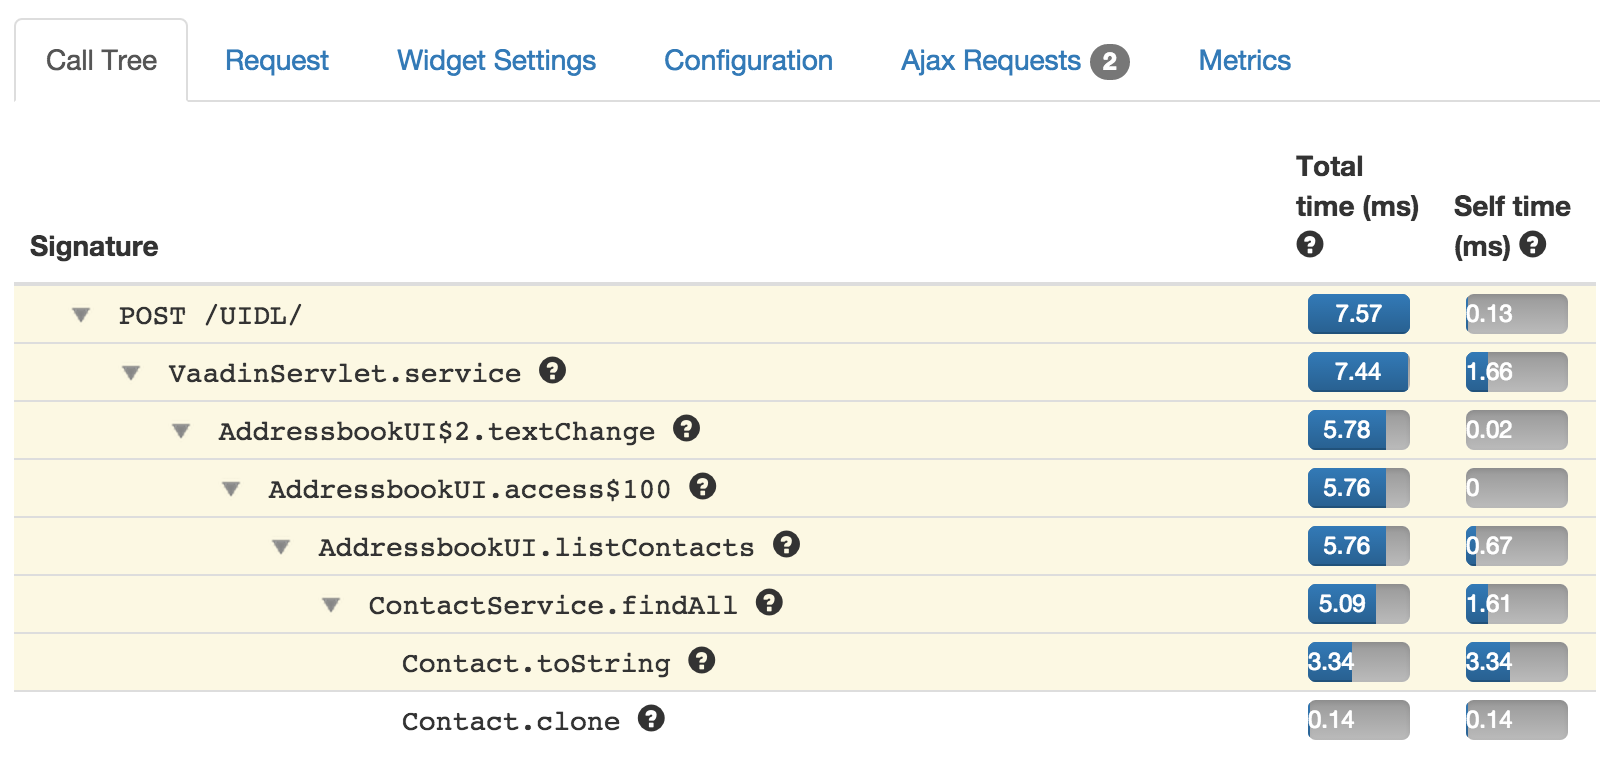
Stagemonitor’s in-browser-widget helps you to optimize your website while you are developing it. Stagemonitor injects a small icon on the lower right corner of your web page. This opens a door into the application monitoring dashboard:
- Call tree - The first screen shows a call tree of all methods and SQL queries that were executed during the current request. That way you can easily identify bottlenecks in your code.
- HTTP requests - In the request tab, you can find general information of the request like the response size, request headers and user agent details.
- Ajax Requests - Stagemonitor is capable of capturing ajax requests. Go to the Ajax Requests tab to select which request you want to analyze.
- Configurable alerts - You can define thresholds for the page load time and the number of SQL queries during a request. The icon notifies you by flashing, if the performance does not keep up with your predefined limits.
- Real time graphs - There is also a metrics tab which shows you live updating graphs, for example of your JVM application and your operating system.
The best thing is that you don’t have to install any kind of backend for that.
Production monitoring
Not only useful for development, but you can also use stagemonitor to monitor your production clusters.
Do you want to know what the most common source of errors is, what the series of requests that lead to an error looked like or why a specific request yesterday at 7:36 was slow? Stagemonitor offers a dashboard you can use to search and analyze detailed request traces of the incoming HTTP requests which gives you the answers.
There are different dashboards for monitoring your whole cluster:
- The request dashboard tells you about the response times and the throughput of your user’s requests. It also lets you quickly identify the business transactions with the highest response time, throughput and error rate.
- The JVM dashboard contains information about the heap utilisation, the garbage collector and the CPU utilisation of the JVM.
- There are even more dashboards that contain metrics, for example of EhCache, logging behaviour, application server stats, database queries and the operating system.
Monitoring Vaadin applications
Stagemonitor supports all servlet based web applications and Vaadin applications are no different.
To enable monitoring you just need to add a few dependencies into your build:
<dependency>
	<groupId>org.stagemonitor</groupId>
	<artifactId>stagemonitor-web</artifactId>
	<version>0.13.0</version>
</dependency>
<dependency>
	<groupId>org.stagemonitor</groupId>
	<artifactId>stagemonitor-os</artifactId>
	<version>0.13.0</version>
</dependency>
<dependency>
	<groupId>org.slf4j</groupId>
	<artifactId>slf4j-simple</artifactId>
	<version>1.7.7</version>
</dependency>
Typically you want to filter out Vaadin internal events and maybe monitor only parts of your own application. You can configure this in the configuration file at src/main/resources/stagemonitor.properties
stagemonitor.instrument.include=com.vaadin.tutorial
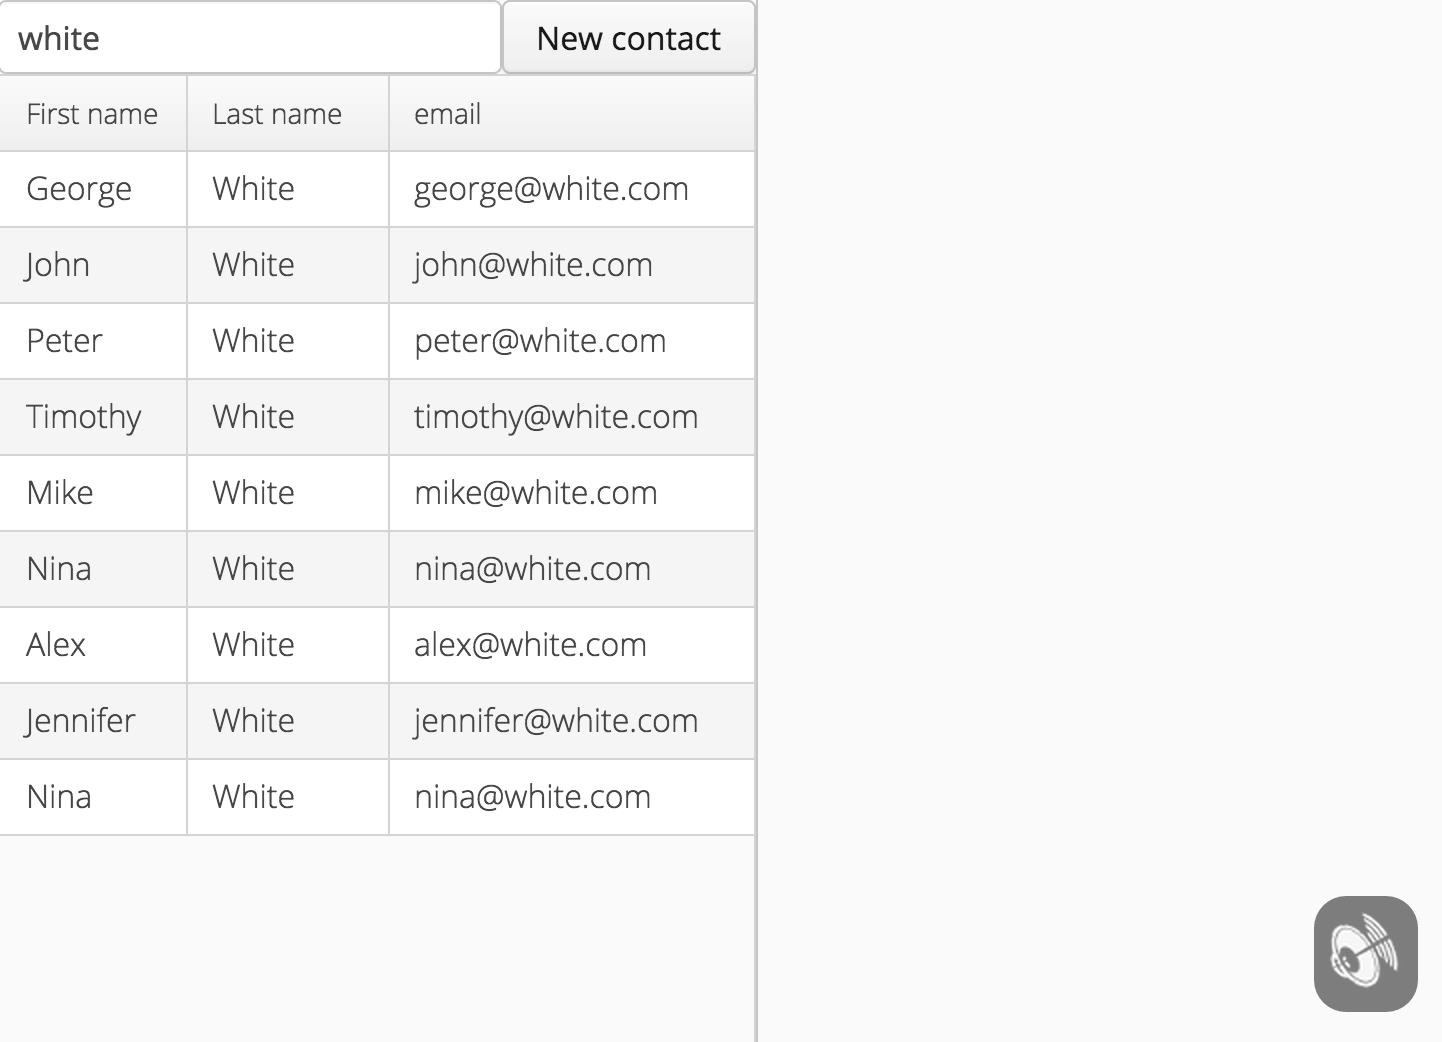
To see how it works in practice, I created a small example based on the “Vaadin Addressbook tutorial”. You can find that in GitHub and try it out. All you have to do is to clone the repository and execute mvn jetty:run. You’ll get a Vaadin application with a stagemonitor button visible on the right bottom corner of your application. Just click that to open the in browser widget.
See the sample in GitHub